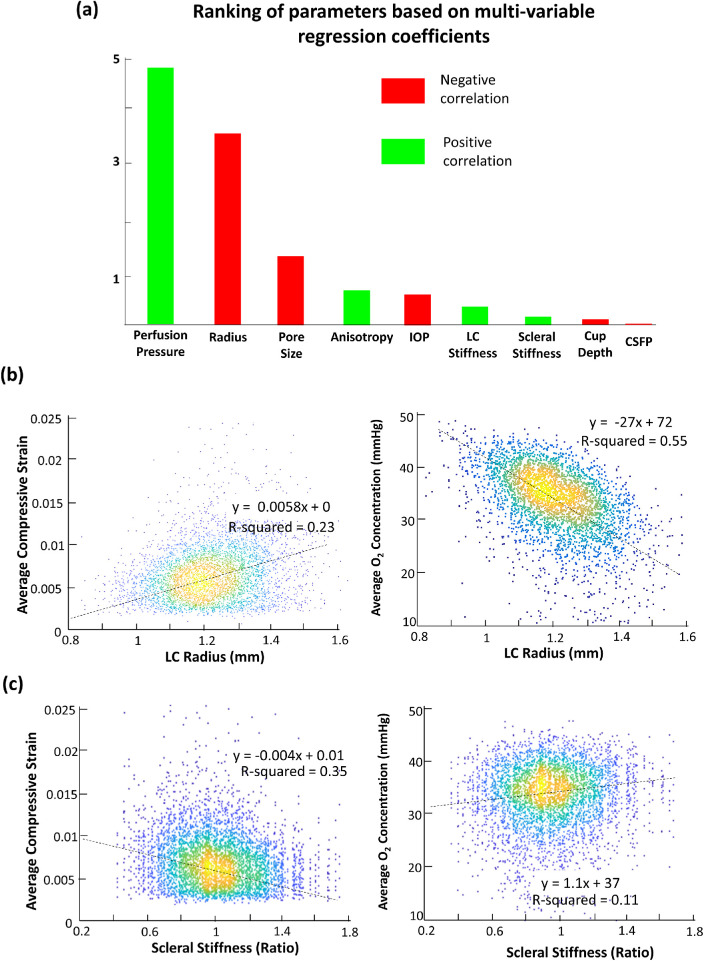
Figure 4.
(a) Bar chart showing the result of multivariable linear regression to rank the importance of all independent variables with respect to average LC oxygen concentration. (b) Scatterplot showing the effects of LC radius on average LC compressive strain and average LC oxygen concentration. (c) Scatterplot showing the effects of scleral stiffness on compressive strain and average oxygen concentration.

