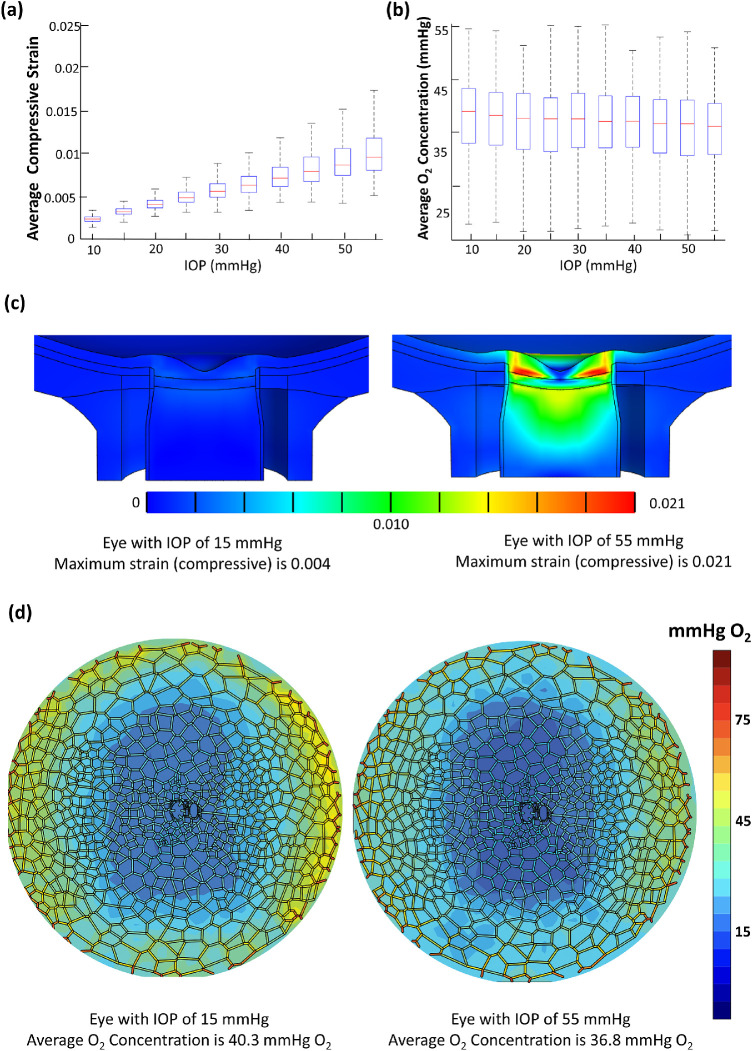
Figure 5.
(a) Box plot showing the relationship between average compressive strain and IOP for 5000 models. Each bar represents 500 models with the same value of IOP. (b) Box plot showing relationship between average oxygen concentration and IOP for 5000 models. (c) A single model comparison of strain in the optic nerve head under IOP of 15 mm Hg and IOP of 55 mm Hg. The values for other parameters are kept at mean. (d) A single model comparison of average oxygen concentration in the LC under IOP of 15 mm Hg and IOP of 55 mm Hg.

