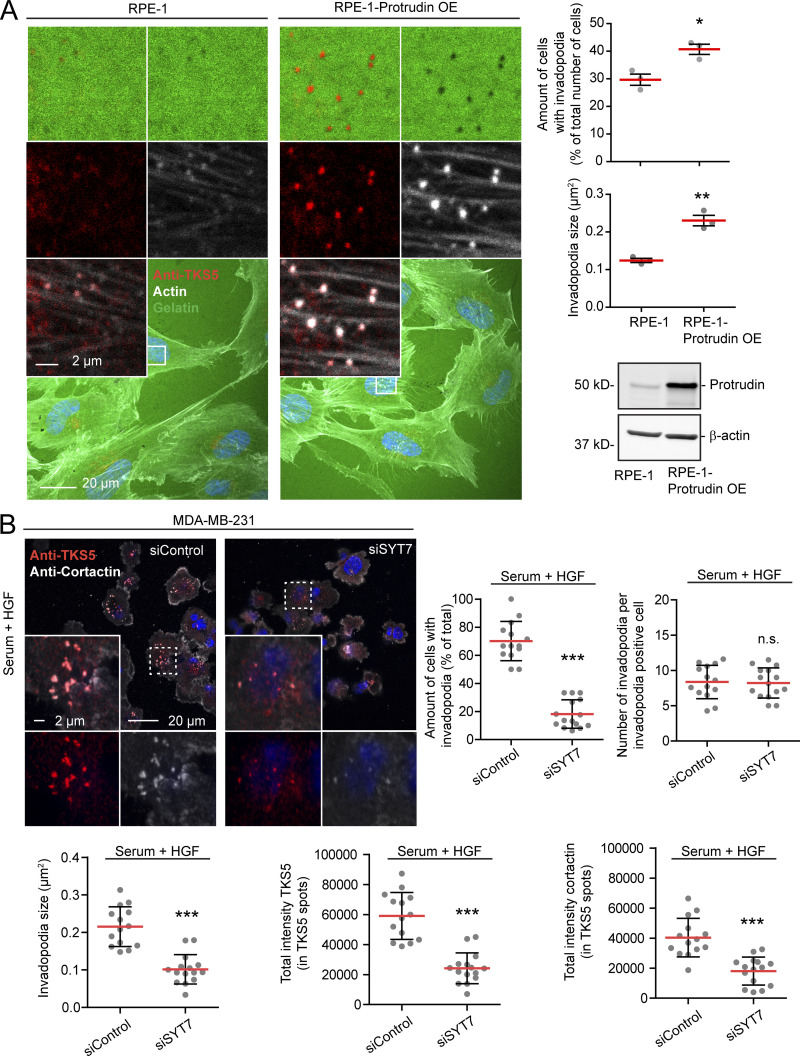
Figure 4.
Invadopodia formation is stimulated by Protrudin overexpression and requires SYT7-dependent membrane fusion. (A) RPE-1 cells with or without stable overexpression (OE) of Protrudin were grown on coverslips coated with Oregon Green gelatin for 4 h in serum containing medium and stained with anti-TKS5 and phalloidin/Alexa Fluor 647 (actin). Confocal micrographs show TKS5- and actin-positive invadopodia correlating with degraded gelatin. The graphs show the amount of cells with invadopodia and the size of invadopodia. Each plotted point represents the average of one independent experiment. Shown is mean ± SEM, n = 3. Total number of cells analyzed per condition: percentage of cells with invadopodia, >200 cells; invadopodia size, >45 cells. *, P < 0.05; **, P < 0.01, unpaired two sided t test. The Western blot shows the expression level of Protrudin in the two cell lines. (B) MDA-MB-231 cells grown on coverslips were transfected with siRNA targeting SYT7 or control siRNA. 1 d after transfection, cells were serum starved for 4 h and treated with Src inhibitor (10 µM PP2) for the last 30 min to remove invadopodia. Cells were stimulated for 1 h with serum containing medium supplemented with HGF (50 ng/ml) to allow reformation of invadopodia. Cells were stained with antibodies against TKS5 and cortactin and analyzed by confocal microscopy. Micrographs show reformation of TKS5-positive invadopodia. Graphs represent quantifications of different features of invadopodia reformation. Each plotted point symbolizes one image representing the average value of typically 15 cells. Values represent mean ± SD. ***, P < 0.001, unpaired two-sided t test. n = 15 images per condition from three independent experiments.

