Figure 6.
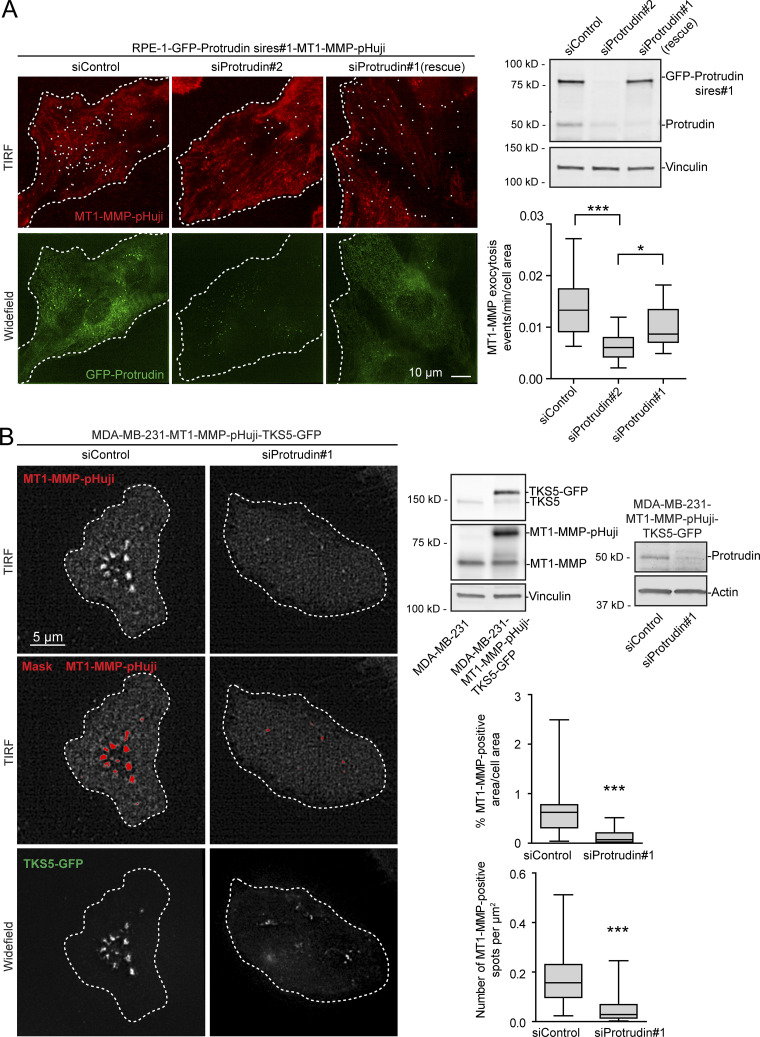
MT1-MMP exocytosis depends on Protrudin. (A) RPE-1-GFP-Protrudin sires#1-MT1-MMP-pHuji cells were seeded in MatTek dishes and transfected with siRNA against Protrudin (oligo #1 or #2) or control siRNA. 2 d after transfection, cells were imaged twice per second for 2 min by TIRF microscopy. Shown are representative TIRF micrographs where individual exocytic events (summed over a 2-min interval) are indicated by a white dot. Widefield micrographs and Western blot analysis show the expression level of GFP-Protrudin and knockdown efficiencies. The graph shows the number of MT1-MMP exocytic events per cell area per minute. For each condition, n = 18 movies were analyzed from three independent experiments. Boxplot whiskers show minimum to maximum. *, P < 0.05; ***, P < 0.001, one-way ANOVA, Tukey’s post hoc test. Note that siProtrudin#2 depletes both endogenous and exogenous Protrudin and reduces the amount of MT1-MMP exocytosis, whereas siProtrudin#1 only depletes the endogenous pool of Protrudin, leaving GFP-Protrudin (sires#1) to maintain MT1-MMP exocytosis. (B) MDA-MB-231-MT1-MMP-pHuji-TKS5-GFP cells were seeded in MatTek dishes and transfected with siRNA against Protrudin (oligo #1) or control siRNA. Western blots show protein expression levels and verify the Protrudin knockdown in the stable cell line. 4 d after transfection, cells were imaged by TIRF microscopy. Shown are representative TIRF micrographs of MT1-MMP-pHuji surface accumulation. Widefield micrographs show TKS5-GFP–positive invadopodia. Plasma membrane exposure of MT1-MMP-pHuji was quantified by segmenting bright pHuji spots from the TIRF images (mask). Graphs show whiskers (minimum to maximum) from n = 30 (siProtrudin) and n = 33 (siControl) TIRF images. ***, P < 0.001, Mann–Whitney test.

