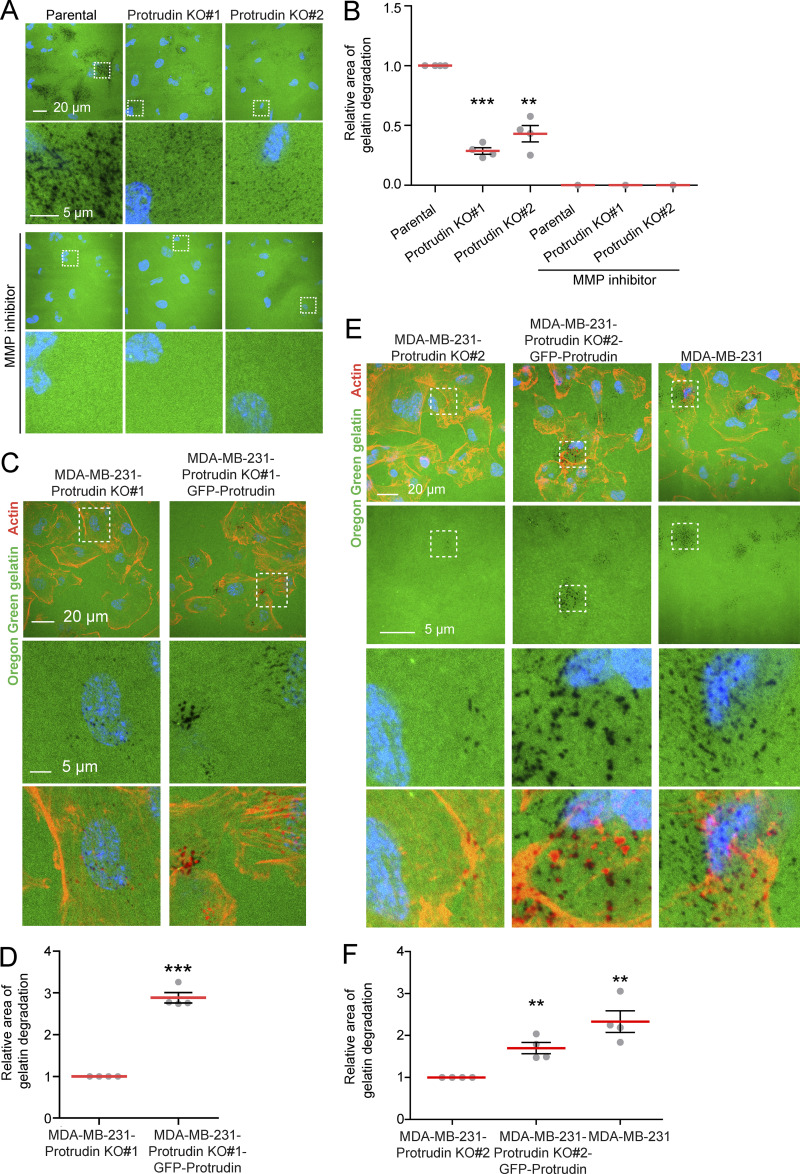
Figure S4.
GFP-Protrudin rescues the loss of gelatin degradation in Protrudin-KO cells. (A) MDA-MB-231 parental or MDA-MB-231-Protrudin-KO (KO#1 and KO#2) cells were grown on coverslips coated with Oregon Green gelatin for 4 h in the absence or presence of the MMP inhibitor GM6001 (20 µM; characterization of cell lines in Fig. S3 A). Confocal micrographs show degradation of the fluorescent gelatin indicated by black areas. (B) Quantifications of experiments displayed in A. The graph shows the relative area of gelatin degradation. Each individual data point represents the average of one independent experiment. Values represent mean ± SD, n = 4 experiments. **, P < 0.01; ***, P < 0.001, one-sample t test. Number of cells in total: parental, 1,156; Protrudin KO#1, 1,146; Protrudin KO#2, 1,174. With MMP inhibitor: n = 1; number of cells: parental, 175; Protrudin KO#1, 163; Protrudin KO#2, 206. (C) MDA-MB-231-Protrudin-KO#1 and MDA-MB-231-Protrudin-KO#1-GFP-Protrudin cells were grown on coverslips coated with Oregon Green gelatin for 4 h, stained with Rhodamine-Phalloidin (actin), and analyzed by confocal microscopy (characterization of cell lines in Fig. S3 A). Representative micrographs show degradation of fluorescent gelatin indicated by black areas. (D) Quantification of images in C. The graph shows relative area of gelatin degradation. Each individual data point represents the average of one independent experiment. Values represent mean ± SD, n = 4. ***, P < 0.001, one-sample t test. In total, >900 cells were analyzed per condition. (E) The indicated cell lines were grown on coverslips coated with Oregon Green gelatin for 4 h, stained with Rhodamine-Phalloidin (actin), and analyzed by confocal microscopy (characterization of cell lines in Fig. S3 A). Representative micrographs show degradation of fluorescent gelatin indicated by black areas. (F) Quantification of images in E. The graph shows relative area of gelatin degradation. Each individual data point represents the average of one independent experiment. Values represent mean ± SD, n = 4. **, P < 0.01, one-sample t test. In total, >750 cells were analyzed per condition.

