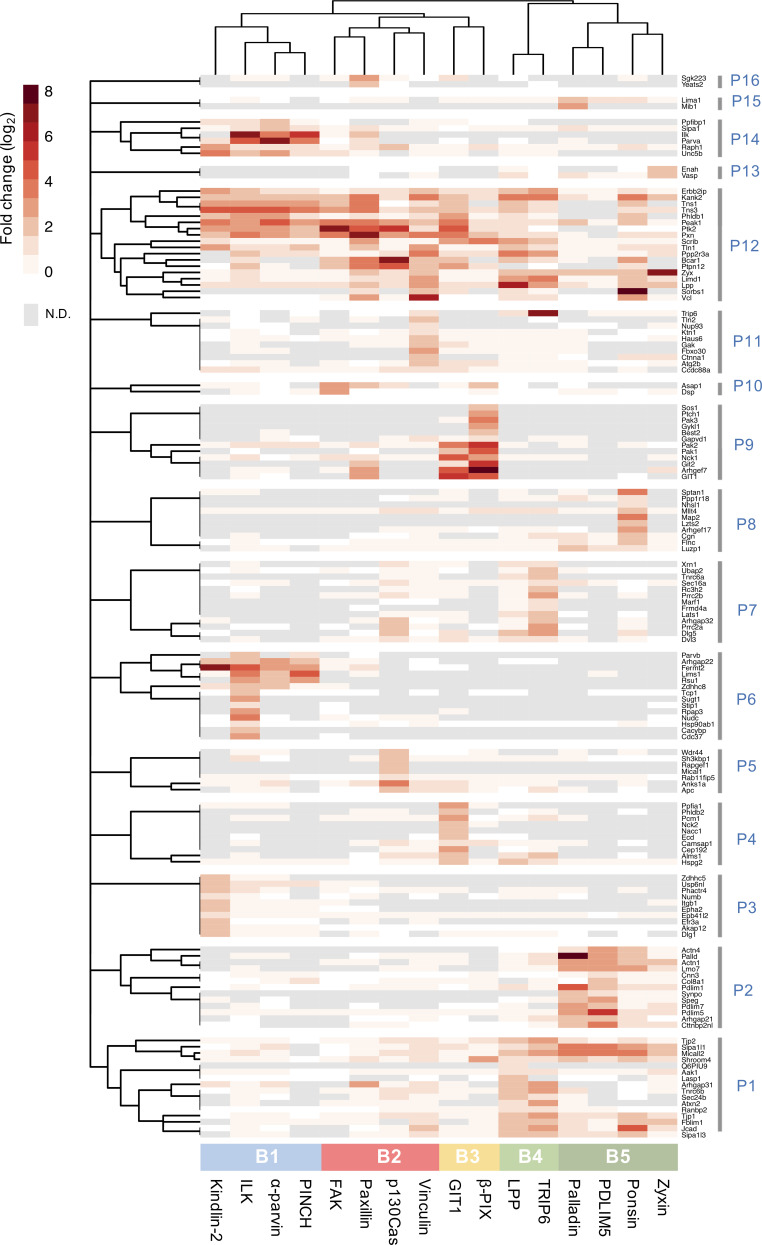
Figure 2.
Hierarchical clustering of BioID data. Hierarchical clustering was performed on the 147 proteins identified in the proximity-dependent adhesome and the results are displayed as a heatmap. BioID baits were clustered using the Jaccard distance of the presence (BFDR ≤ 0.05) or absence (BFDR > 0.05) of prey. Prey proteins were clustered using the Euclidean distance of log2 fold-change enrichment over BirA* control. Log2 fold-changes of prey proteins are displayed as a heatmap. Dendrograms were split to identify clusters of baits (B1–B5, color coded) and prey (P1–P16). N.D., not detected.

