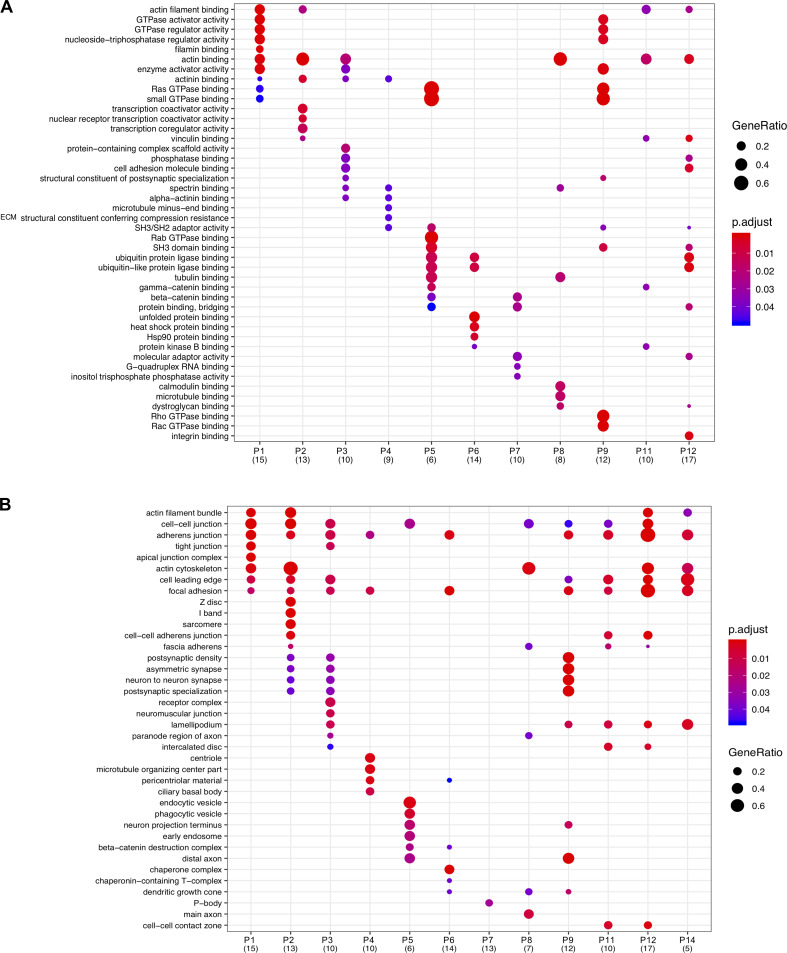
Figure S4.
Functional enrichment analysis of prey clusters. (A and B) GO analysis of the prey clusters identified from hierarchical clustering of the proximity-dependent adhesome (Fig. 2) with a minimum of five proteins. The top five overrepresented GO terms under the molecular function (A) or cellular component (B) category for each prey cluster are listed and displayed for each cluster if identified with an adjusted P value ≤ 0.05. The number of proteins per prey cluster is shown in brackets. p.adjust, adjusted P value. GeneRatio, proportion of total proteins identified in each GO term.

