Figure 2.
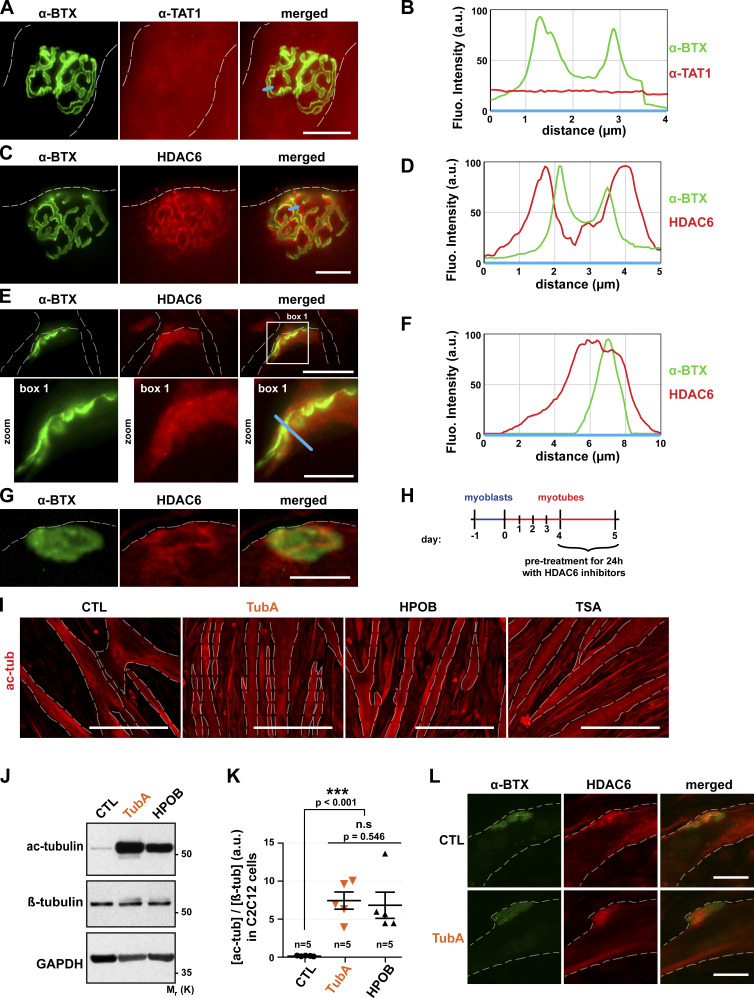
In muscle cells, HDAC6 is enriched within postsynaptic domains, and its inhibition increases tubulin acetylation. (A, C, E, G, I, and L) Isolated fibers (A and C) and cross sections (E) of TA muscles from 2-mo-old mice and 5-d-old C2C12 myotubes (G and L) were stained in red with an antibody against α−TAT1 (A), HDAC6 (C, E, G, and L), or acetylated tubulin (ac-tub; I). NMJs and AChR clusters were labeled with α-BTX–A488 (A, C, E, G, and L; in green). (B, D, and F) The fluorescence intensity of each staining was plotted as a function of the distance (based on the blue line scans in A, C, and E, respectively). (H) Schematic representation of the experimental time course. (I–L) 4-d-old myotubes pretreated for 24 h with different HDAC6 inhibitors TubA (5 µM) and HPOB (5 µM), with the pan-HDAC inhibitor TSA (0.1 µM), or with DMSO (CTL, 1 µl). (J) Representative Western blots showing acetylated tubulin (Ac-tubulin) and β-tubulin expressions. GAPDH was used as a loading control. (K) Quantification of acetylated tubulin protein levels normalized with β-tubulin (n = number of independent Western blots quantified; 5). Graphs show means ± SEM. ***, P < 0.001; n.s not significant; Mann-Whitney U test. Dashed lines indicate edges of cells. Scale bars: 25 µm (A, C, E, G, and L); 400 µm (I); inset magnifications (E; box 1): 10 µm. Fluo., fluorescence; β-tub, β-tubulin, n.s, not significant; Mr(K), relative molecular weight in kiloDalton; ac-tub and ac-tubulin, acetylated tubulin.

