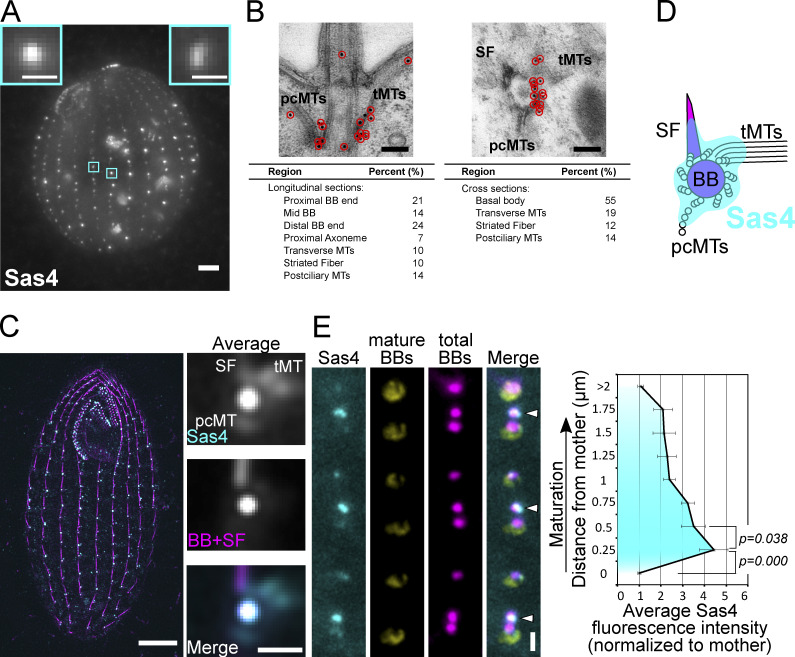
Figure 1.
Sas4 localizes to new BBs and to BB-appendage structures. (A) Sas4:HaloTag (grayscale; JF549) localizes to cortical and oral apparatus BBs. Scale bar, main image, 5 µm. Scale bars, insets, 1 µm. Insets denote individual BBs. (B) Sas4 immuno-electron microscopy localization to BBs, pcMTs, tMTs, and striated fibers. Scale bars, 200 nm. (C) SIM and image averaging of Sas4:HaloTag (JF549) localization at BBs and at proximal positions of BB-appendage structures (tMTs, pcMTs, and striated fibers). Cells were labeled with JF549 HaloTag ligand (cyan) and stained with an anti-Sas6A antibody (magenta) that labels BBs and SFs (Culver et al., 2009). Mature BBs were used for image averaging where each BB was centered on the centroid of the BB signal and oriented relative to the striated fiber. Right panels, average of 530 BBs. Scale bar (whole cell), 5 µm. Scale bar (right panels), 1 µm. (D) Model of Sas4 localization based on immuno-EM and SIM image averaging shown in B and C. (E) Sas4 is enriched at newly assembling daughter BBs. Sas4:HaloTag (cyan; JF549) was visualized relative to mature BBs (yellow; K-like antigen [Kl-Ag]; Williams et al., 1990) and all BBs (magenta; centrin). Arrowheads denote newly assembled BBs that are enriched for Sas4. Scale bar, 1 µm. Distance between peak centrin signals was used to calculate distance between the mother BB (Kl-Ag–positive) and daughter BBs (centrin). The average Sas4 fluorescence intensity is plotted as a function of distance from a mother BB. Data were collected from 10 cells per replicate, and three experimental replicates were performed, with a total of 702 daughter BBs analyzed. Error bars denote SEMs.

