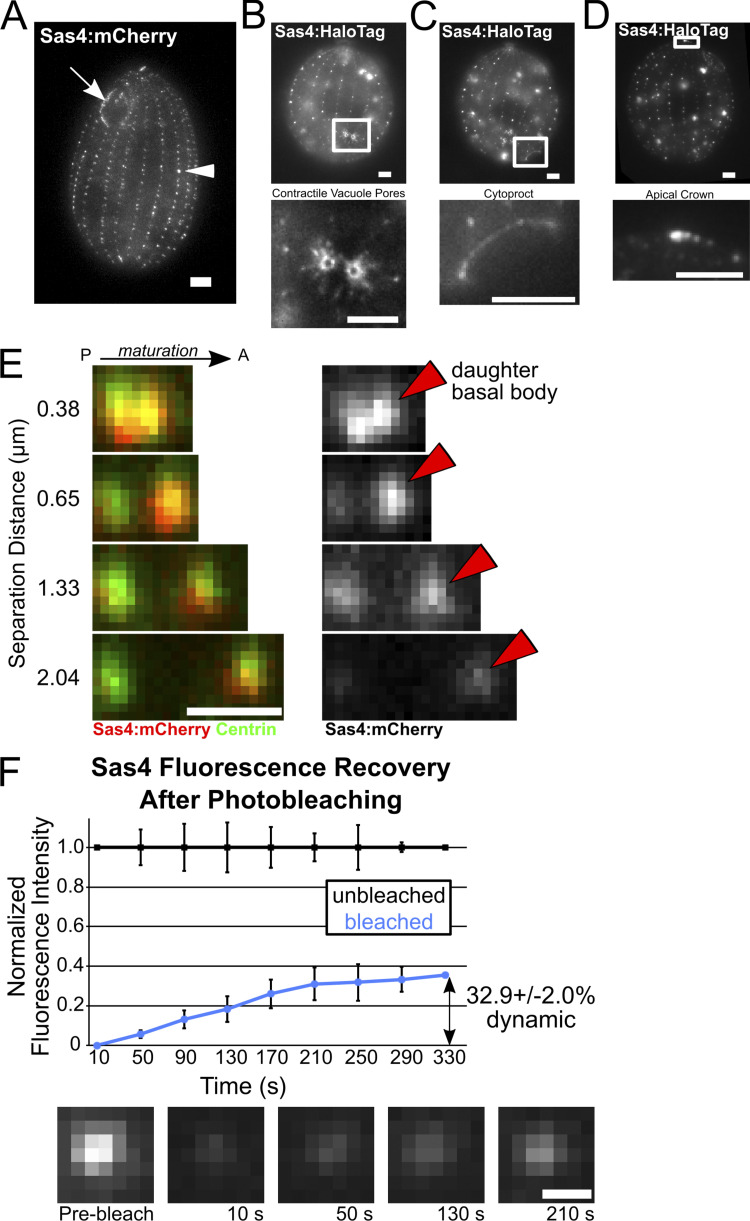
Figure S2.
Sas4 localization and dynamics. (A) Endogenous Sas4:mCherry (grayscale) localization to the cortical and oral apparatus BBs. All localizations described here (A–E) and in the main text are identical between HaloTag and mCherry fusions to Sas4. (B) Endogenous Sas4:HaloTag (grayscale; JF549) localizes to contractile vacuole pores (CVPs). Bottom panel, enlarged image of CVPs. CVPs are MT-based structures used for osmotic regulation (Organ et al., 1972). (C) Endogenous Sas4:HaloTag (grayscale; JF549) localizes to the cytoproct. Bottom panel, enlarged image of the cytoproct. Tetrahymena cytoprocts are sites of waste elimination (Allen and Wolf, 1974). (D) Endogenous Sas4:HaloTag (grayscale; JF549) localizes to the Tetrahymena apical crown. Bottom panel, enlarged image of the apical crown. The apical crown is a site of closely positioned doublet BBs (Jerka-Dziadosz, 1981). Scale bars, 5 µm. (E) Endogenous Sas4:mCherry (red at left, grayscale at right) is enriched at daughter BBs (red arrowheads). Costaining with centrin (green) to mark all BBs. Signal for mCherry is from the fluorescent protein itself, not from antibody staining against mCherry. P, posterior; A, anterior. Scale bar, 1 µm. (F) mCherry:Sas4 FRAP. Graph shows normalized signal for recovery of four bleached (blue) and four unbleached (black) BB. Error bars denote SD. Representative images of fluorescence recovery at a bleached BB. Scale bar, 500 nm.

