Figure 1.
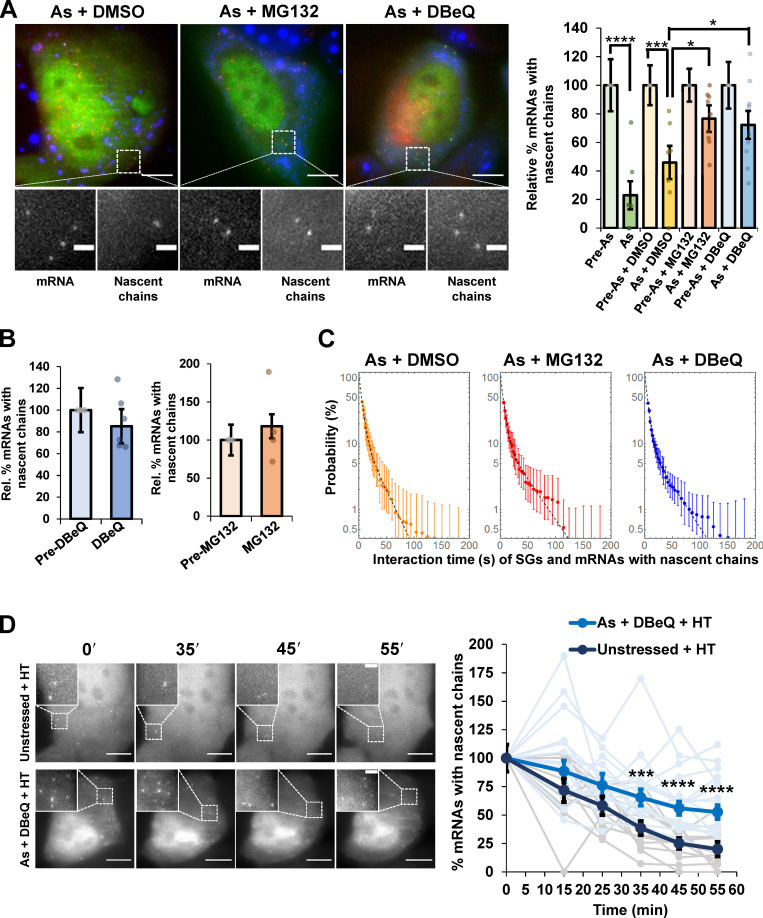
Translating ribosomes stall on reporter mRNAs during arsenite stress and require VCP and proteasome activity to be resolved. (A) Left: Representative images of SM-KDM5B reporter mRNAs tagged with MS2 coat protein (MCP)–Halo JF646 (red) with nascent chains visualized with Cy3–anti-FLAG antibody fragments (green) in cells expressing the SG marker GFP-G3BP1 (blue) cotreated with arsenite (As) and DMSO, MG132, or DBeQ. Scale bars, 10 µm. Magnified panels show individual mRNAs and nascent chains. Scale bars, 2 µm. Right: Average relative percent SM-KDM5B reporter mRNAs with nascent chains ± SEM with individual points representing a single cell relative to prestress levels for As (0.5 mM, n = 7 cells), As + DMSO (0.1%, n = 7 cells), As + MG132 (10 µM, n = 9 cells), and As + DBeQ (10 µM, n = 9 cells). Student’s t test was done to assess significance, with *, P ≤ 0.05; ***, P ≤ 0.005; and ****, P ≤ 0.001. (B) The percentage of SM-KDM5B reporter mRNAs visualized as in A in cells before or after treatment with DBeQ (left; 10 µM, n = 6 cells) or MG132 (right; 10 µM, n = 4 cells) alone. (C) Average binding-time survival probability (±SEM) of SM-KDM5B mRNAs associated with nascent chains and SGs in cells cotreated as in A with As + DMSO (n = 6 cells), As + DBeQ (n = 14 cells), and As + MG132 (n = 10 cells). (D) Cells harboring SM-KDM5B reporter mRNAs, FLAG antibody fragments, and MCP–Halo JF646 were either unstressed and treated with HT or stressed with As and cotreated with DBeQ and HT. Images were acquired prestress and then in 10-min intervals starting 15 min later. HT was added 15 min after As + DBeQ (or no treatment). Left: Representative time series of unstressed cells (top) and As + DBeQ cells (bottom) treated with HT. Scale bars, 10 µm (in whole cell) and 2 µm (in insets). Right: The average ± SEM of the percent SM-KDM5B mRNAs with nascent chains at each time point relative to prestress conditions is shown in unstressed cells (black) and As-stressed cells treated with DBeQ (blue), with individual cells shown in gray (unstressed + HT, n = 13 cells) and light blue (As stress + DBeQ + HT, n = 17 cells). Student’s t test was done to assess significance between untreated + HT and As + DBeQ + HT conditions at each time point, with ***, P ≤ 0.005 and ****, P ≤ 0.001. Exact P values and source data are listed in Table S1.

