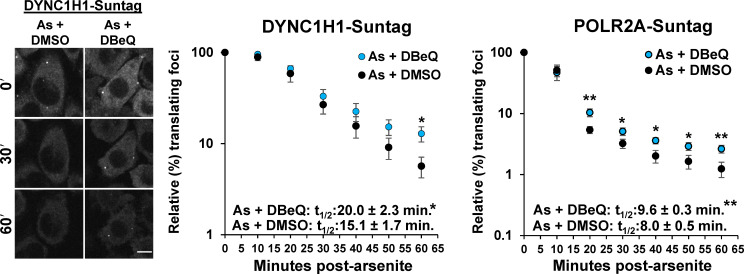
Figure S1.
Nascent peptides visualized with SunTags are elevated in arsenite-stressed cells upon VCP inhibition. HeLa cells with endogenously tagged SunTagX32-DYNC1H1 (DYNC1H1-Suntag) and SunTagX56-POLR2A (POLR2A-Suntag) genes and stably expressing scFv-sfGFP (Pichon et al., 2016) were imaged every 10 min in a humidified, 37ºC chamber on a spinning disc microscope at 40× for 1 h following treatment with 0.5 mM arsenite (As), cotreated with 0.1% DMSO or 10 µM DBeQ. A representative time series (0, 30, and 60 min after stress) is shown at left for the SunTagX32-DYNC1H1 cell line. Scale bar, 10 µm. Shown at right is the average ± SEM of the relative percent SunTag foci in each frame from n = seven independent experiments for each cell line. Student’s t test was done to assess significance between the relative number of translating foci in DMSO- versus DBeQ-treated cells at each time point, with *, P < 0.05 and **, P < 0.01. Insets: Data were fit with exponential trendlines to calculate the time when 50% of translation foci (t1/2) were present compared with prestress images for each replicate (DYNC1H1-Suntag: As + DBeQ R2 = 0.9527, As + DMSO R2 = 0.9616; POLR2A-Suntag: As + DBeQ R2 = 0.8405, As + DMSO R2 = 0.8334). Student’s t test was used to assess significance, with *, P < 0.05 and **, P < 0.01. Exact P values and source data are provided in Table S1.

