Figure 3.
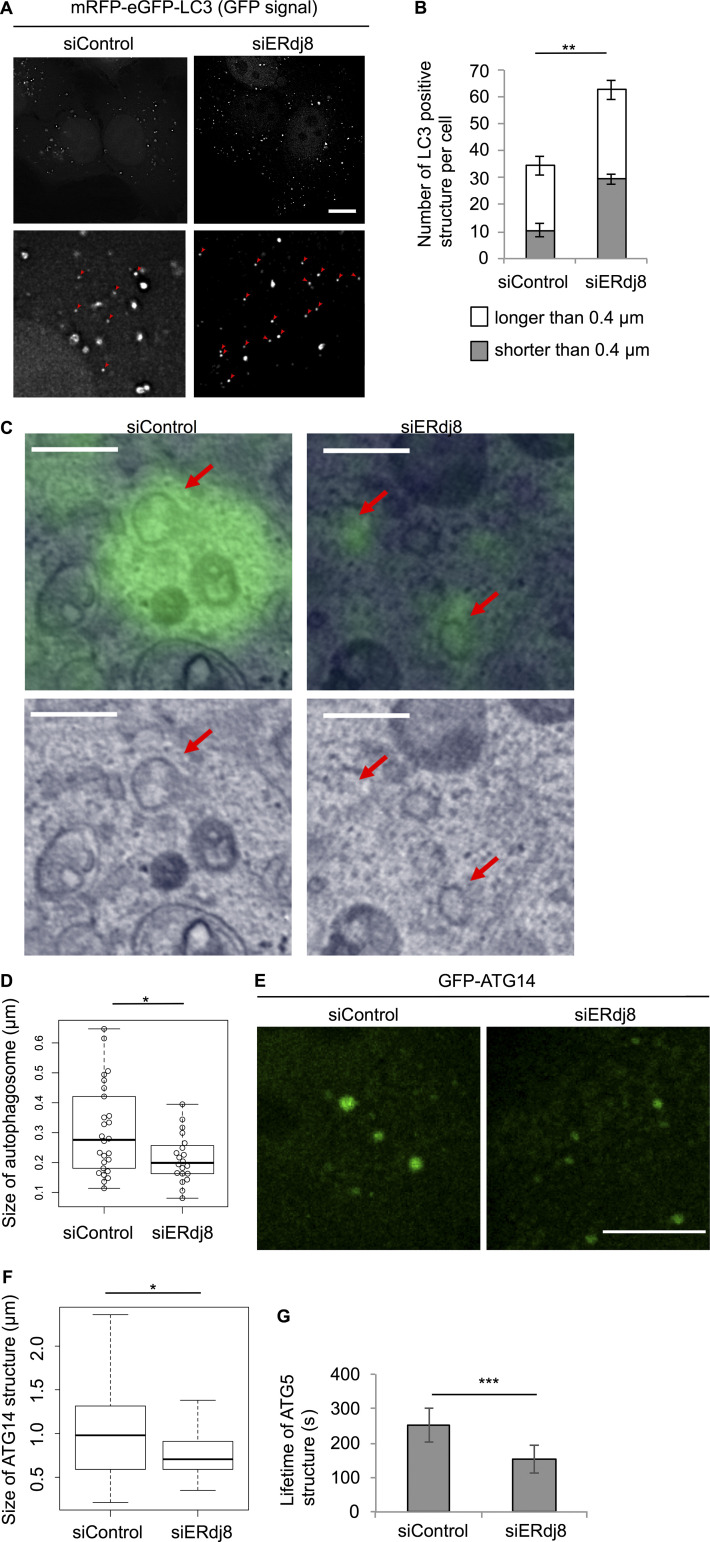
ERdj8 knockdown decreases autophagosome size. (A) HeLa cells stably expressing tandem fluorescent-tagged LC3 (tfLC3) were treated with small interfering RNA (siRNA; siERdj8no1 or control), incubated for 96 h, and imaged on a DeltaVision system. Insets are enlargements of framed regions. Smaller GFP-positive puncta are indicated by red arrowheads. Scale bar, 10 µm. (B) Length of the most distal point in each of the eGFP-positive puncta. Numbers of eGFP-positive puncta longer or shorter than 0.4 µm in all cells are shown. **, P < 0.005 by t test. Results are shown as means of a total of 10 cells ± SEM. (C and D) HeLa cells stably expressing eGFP-LC3 were treated with siRNA (siERdj8no1 or control), starved for 1 h, and subjected to CLEM analysis. Scale bar, 0.5 µm. Red arrows show autophagosomes. Diameters of GFP-LC3–positive autophagosomes were measured in control (26 autophagosomes) and siERdj8 (20 autophagosomes). *, P < 0.05 by t test. Mean of GFP-ATG14–positive puncta ± SD. Median: lines, upper and lower quartiles: boxes; 1.5-interquartile range: whiskers. Significance of differences was evaluated by unpaired two-tailed t test. (E) HeLa cells stably expressing GFP-ATG14 were treated with siRNA (siERdj8 no1 or control), incubated for 96 h, and imaged on an SP-8. Scale bar, 10 µm. (F) Length of the most distal point in each of the eGFP-positive puncta. *, P < 0.05 by ANOVA, Tukey–Kramer test. Mean of five cells ± SD. Median: lines; upper and lower quartiles: boxes; 1.5-interquartile range: whiskers. (G) HeLa cells stably expressing GFP-ATG5 were treated with either siRNA (siERdj8no1 or control), incubated for 72 h, and imaged on a DeltaVision system. Live images were acquired at intervals of 10 s. Lifetime of each GFP-ATG5–positive structure. An average of 18 signals is shown. ***, P < 0.001. Error bars indicate SEM.

