Figure 1.
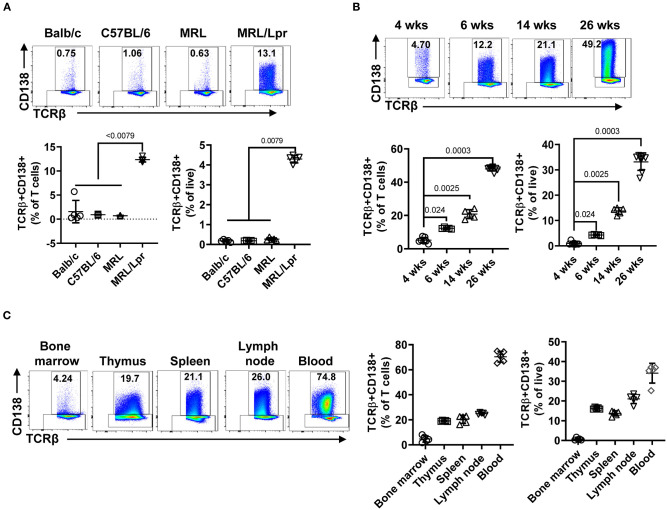
TCRβ+CD138+ cells populate the spleen, lymph nodes, thymus, and blood of MRL/Lpr mice, and their numbers increase with age. In each flow cytometry experiment TCRβ+CD138+ cells were quantified after gating out dead cells and CD19+ B cells. (A) Splenic TCRβ+CD138+ cells from 6 weeks old Balb/c, C57BL/6, MRL, and MRL/Lpr mice were quantified. Representative pseudocolor plots from each mouse strain are shown. Mean percentages ± SD of five mice from two independent experiments are plotted. Two-way ANOVA test was used to calculate statistical significance. The means of the four groups were statistically significantly different (p < 0.0001) in 2-way ANOVA test. Mann Whitney test was used to calculate the exact p-value for the comparisons between MRL/Lpr and other groups. (B) Splenic TCRβ+CD138+ cells from 4, 6, 14, to 26 weeks old MRL/Lpr mice were quantified. Representative pseudocolor plot from each time point is shown. Mean percentages ± SD of five to eight mice from three separate experiments are plotted. Two tailed Mann-Whitney rank sum test was used to calculate statistical significance. (C) TCRβ+CD138+ cells in bone marrow, thymus, spleen, lymph nodes, and blood of 14 weeks old MRL/Lpr mice were quantified. Representative pseudocolor plots from each organ are shown. Mean percentages ± SD of five mice from two independent experiments are plotted.

