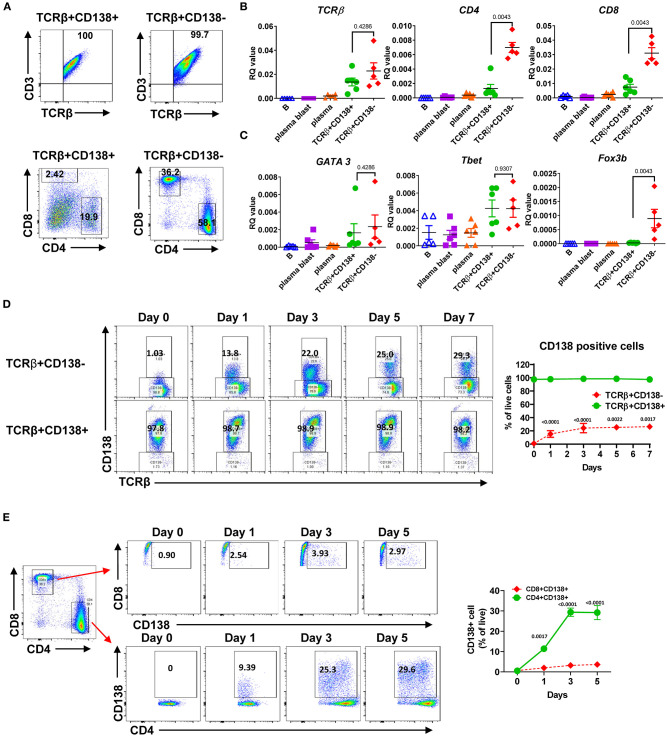
Figure 2.
Most of the TCRβ+CD138+ cells are CD4 and CD8 negative while some derive from CD4+ T cells. (A) Splenocytes were harvested from 14 weeks old MRL/Lpr mice. After pre-gating live and single cells, TCRβ+CD138+ and TCRβ+138- cells were further analyzed for CD3, CD4, and CD8 expression by flow cytometry. Representative pseudocolor plots from out of five mice are shown. (B,C) Splenocytes were collected from 14 weeks old MRL/Lpr mice. CD19+ B cells, CD19+CD138- plasmablasts, CD19-CD138+ plasma cells, CD19-TCRβ+CD138- cells, and CD19-TCRβ+CD138+ cells were sorted by flow cytometry. The mRNA expression levels of cell surface molecules TCRβ, CD4, CD8 (B) and transcription factors GATA3, Tbet, and Foxp3 (C) were quantified in Q-PCR. Mean ± SD of five to six mice from three independent experiments are plotted. (D) Splenocytes were collected from 14 weeks old MRL/Lpr mice. After removing CD19+ B cells, TCRβ+CD138-, and TCRβ+CD138+ cells were sorted with magnetic beads and then cultured separately for 5 days. Frequencies of CD138-expressing TCRβ+ cells were quantified by flow cytometry. Representative pseudocolor plots are shown. Mean percentages ± SD of six mice from three independent experiments are plotted. (E) Splenocytes were collected from 14 weeks old MRL/Lpr mice. After removing CD19+ B cells, CD4+TCRβ+CD138-, and CD8+TCRβ+CD138- cells were sorted with magnetic beads and then cultured separately for 5 days. Frequencies of CD138-expressing CD4+ and CD8+ T cells were measured by flow cytometry. Mean percentages ± SD of six mice from three separate experiments are plotted. Two tailed Mann-Whitney rank sum test was used to calculate statistical significance.

