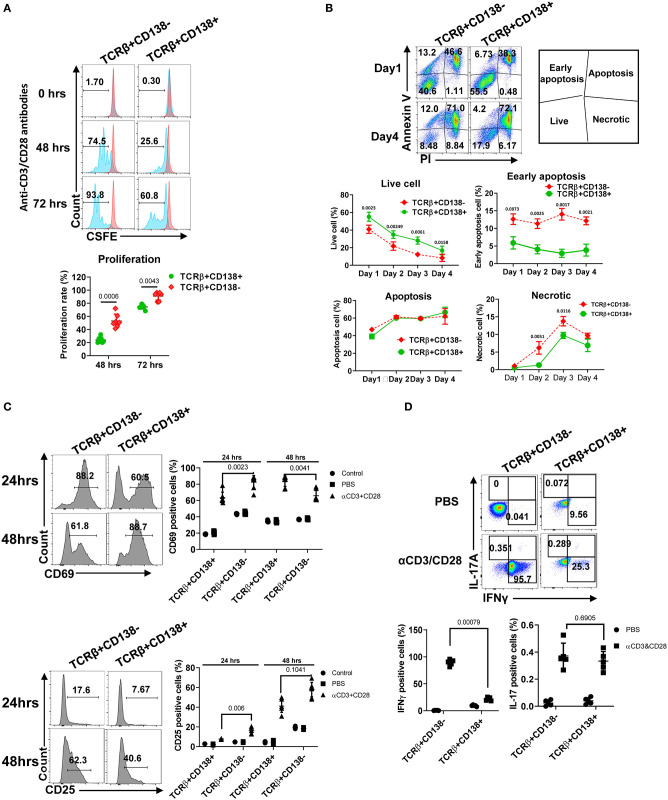
Figure 3.
TCRβ+CD138+ cells proliferate less and resist early apoptosis after activation. (A) Splenic TCRβ+CD138+ and TCRβ+CD138- were sorted with magnetic beads and pre-stained with CSFE prior to stimulation with anti-CD3/CD28 antibodies for 3 days. The proliferation was assessed by flow cytometry. Representative histogram images are shown. Mean percentages ± SD of seven mice from three separate experiments are plotted. (B) Sorted splenic TCRβ+CD138+ and TCRβ+CD138- were stimulated for 4 days with anti-CD3/CD28 antibodies. Live, early apoptotic, apoptotic, and necrotic cells were measured by flow cytometry. Representative pseudocolor plots are shown. Mean percentages ± SD of six mice from three independent experiments are plotted. (C) Sorted splenic TCRβ+CD138+ and TCRβ+CD138- cells were activated with anti-CD3/CD28 antibodies for 24 or 48 h. Cells were stained with CD69 and CD25 antibodies to assess activation kinetics in flow cytometry. Representative histogram images indicating the frequency of positive cells are shown. Mean percentages ± SD of seven mice from three independent experiments are plotted. (D) Sorted splenic TCRβ+CD138+ and TCRβ+CD138- cells were activated with anti-CD3/CD28 antibodies for 16 h. Representative pseudocolor plots show intracellular IFNγ, and IL-17 staining. For each cytokine, mean ± SD of five mice are plotted. Two tailed Mann-Whitney rank sum test was used to calculate statistical significance.

