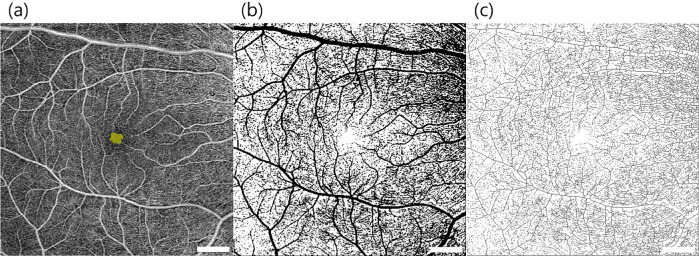
Figure 2.
Image processing steps for microvascular analysis of an en face optical coherence tomographic angiography projection image within the 6 × 6-mm macular cubes at the level of the superficial capillary plexus. (a) FAZ area is shown in yellow. (b) A binarized image was used to measure the perfusion index, and (c) skeletonization was performed to calculate the vessel density using the tools provided in the ImageJ software. The scan-logo in the bottom right of the images was masked for analysis.

