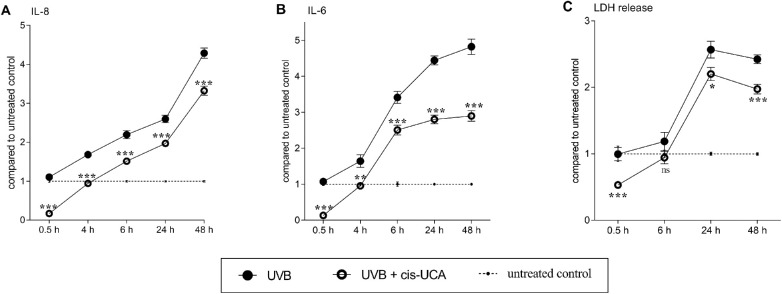
Figure 6.
Therapeutic effect of cis-UCA on the secretion of IL-8, IL-6, and LDH in UV-B-exposed HCE-2 cells. HCE-2 cells were exposed to UV-B (0.2 J/cm2) and subsequently treated with cis-UCA (100 µg/mL). Cell culture mediums were collected either 0.5, 4, 6, 24, or 48 hours after the cis-UCA application, and the secretion levels of (A) IL-8 and (B) IL-6 were measured by an ELISA method. (C) Cell membrane integrity was assessed with the LDH assay. (A-C) Results have been converted into the mean of untreated control cells, which is presented in the figure as 1 (dotted line). UV-B (•) and UV-B + cis-UCA (○) groups were compared at every time point and the differences were analyzed with the Mann-Whitney U-test. Results are represented as mean ± SEM. *P < 0.05, **P < 0.01, ***P < 0.001, ns = not significant.

