Figure 2.
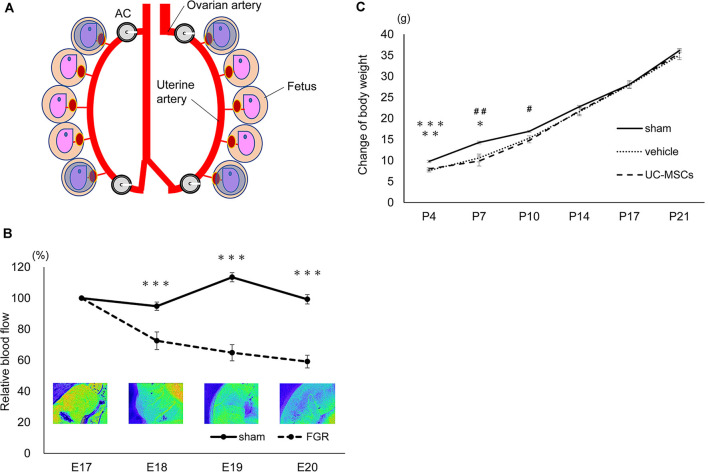
Characters of the fetal growth restriction (FGR) model using the Ameroid constrictor. (A) The measurement area. We applied circle ROIs (blue circles) on the inside of the whole uteri and measured the four fetuses: top and bottom of the bilateral uteri before and after AC attachment on embryonic day 17 (E17) as well as E18, 19, and 20. (B) The changes in blood flow over time. The measurement of the blood flow every 24 h after the attachment of the AC in the sham group (n = 12) and the FGR group (n = 7). In the FGR group, the blood flow gradually decreased over time, and on the 20th day of pregnancy, just before birth, the blood flow had decreased to about 60% (sham, n = 12; FGR, n = 7). ***sham vs. FGR, p < 0.001. (C) The body weight change of each group. At P4 and P7 days of age, the mean body weight of the sham group was significantly higher than that of the vehicle and the umbilical cord-derived mesenchymal stromal cell (UCMSC) groups. Both the vehicle group and the UC-MSC group subsequently caught up with the sham group, and the significant difference disappeared (sham, n = 21; vehicle, n = 26; UC-MSCs, n = 23). *sham vs. vehicle, p < 0.05; #sham vs. UC-MSCs, p < 0.05; **sham vs. UC-MSCs, p < 0.01; ##sham vs. UC-MSCs, p < 0.01; ***sham vs. vehicle, p < 0.001.

