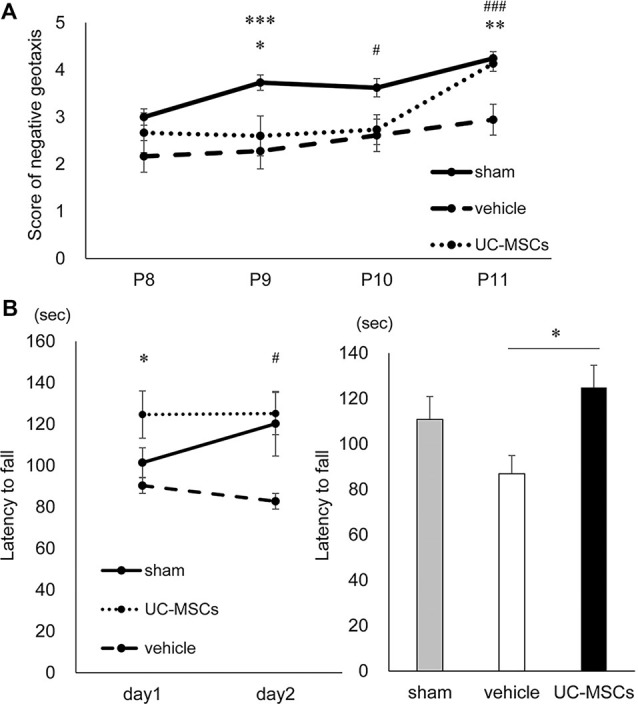
Figure 3.

Behavioral tests. (A) Negative geotaxis. At postnatal day 9, both the vehicle group and the UC-MSC group were significantly lower scores than the sham group. At postnatal day 10, the vehicle group was significantly lower than the sham group. At postnatal day 11, the vehicle group was significantly lower than the sham group, and the UC-MSC group significantly improved over the vehicle group. Sham group is represented by a solid line, vehicle group by a dashed line and UC-MSC group by a dotted line (sham, n = 37; vehicle, n = 18; UC-MSCs, n = 15). *sham vs. UC-MSCs, p < 0.05; #sham vs. vehicle, p < 0.05; **UC-MSCs vs. vehicle, p < 0.01; ***sham vs. vehicle, p < 0.001; ###sham vs. vehicle, p < 0.001. (B) Rotarod treadmill test. The average daily values were calculated. The left bar graph shows a daily average, and the right bar graph does an average of total observations. The duration was shortened in the vehicle group and prolonged in the UC-MSC group at P154-155. Sham group is represented by a solid line, vehicle group by a dashed line and UC-MSC group by a dotted line (sham, n = 7; vehicle, n = 9; UC-MSCs n = 7). *UC-MSCs vs. vehicle, p < 0.05; #UC-MSCs vs. vehicle, p < 0.05.
