Figure 4.
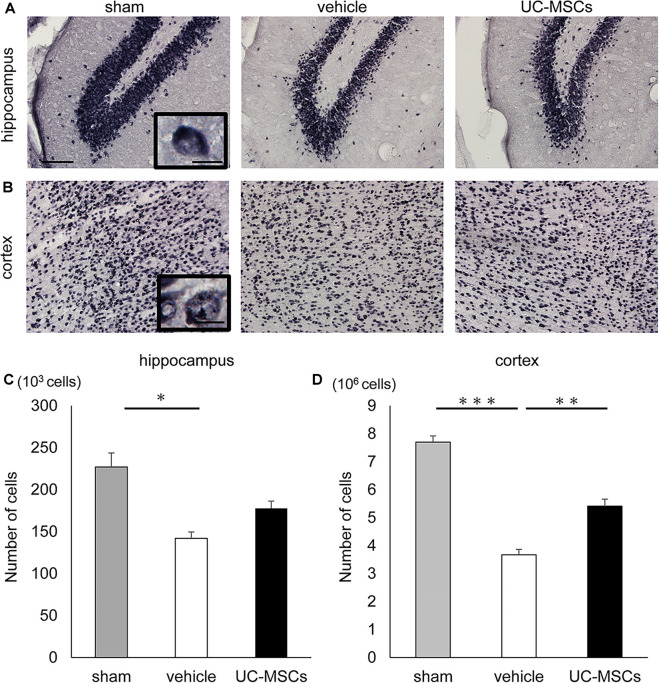
Effects of UC-MSC treatment on neurons in FGR. Representative photomicrographs of the hippocampus (A) and part of the cortex (B) 2 months after birth. Scale bar = 100 μm. The inset shows a higher magnification view. Scale bar = 10 μm. (C) The number of positive cells for NeuN in the hippocampus was significantly lower in the vehicle group than in the sham group, although there was no significant difference between the UC-MSC group and the sham group (sham, n = 8; vehicle, n = 3; UC-MSCs n = 4). *p < 0.05. (D) The number of positive cells for NeuN in the cortex was significantly lower in the vehicle group than that in the sham group, and a significant amelioration was observed in the UC-MSC group (sham, n = 8; vehicle, n = 3; UC-MSCs n = 4). **p < 0.01, ***p < 0.001.

