Figure 5.
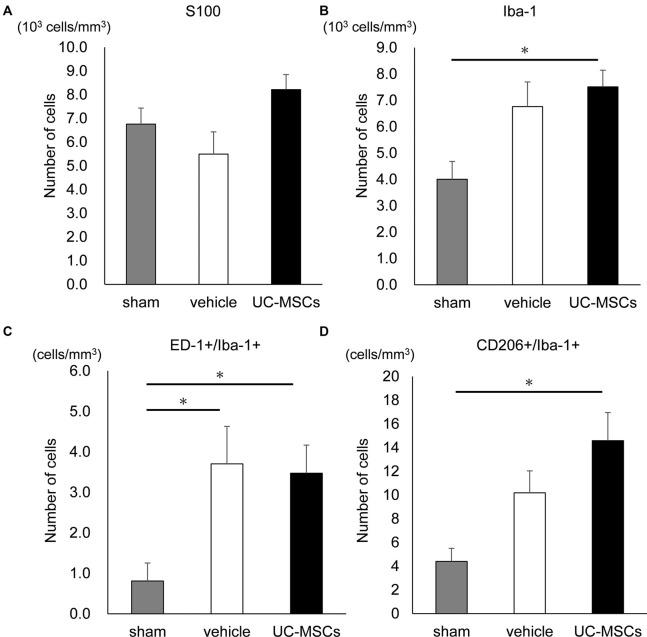
Effects of UC-MSC treatment on astroglia and microglia in FGR. (A) There was no significant difference among the three groups in the number of S100 positive cells in the cortex. (B) The number of Iba-1 positive cells in the cortex was significantly higher in the UC-MSC group compared to the sham group (sham, n = 8; vehicle, n = 3; UC-MSCs, n = 4). *p < 0.05. The number of ED-1 and Iba-1 double-positive cells (C) and CD206 and Iba-1 double-positive cells (D) in the cortex with fluorescent immunostaining. The number of ED-1+/Iba-1+ in both the UC-MSCs and the vehicle were significantly higher than that in the sham (sham, n = 8; vehicle, n = 3; UC-MSCs, n = 4). *p < 0.05, whereas that of CD206+/Iba-1+ in the UC-MSCs was significantly higher than that in the sham (sham, n = 8; vehicle, n = 3; UC-MSCs, n = 4). *p < 0.05.

