Figure 1.

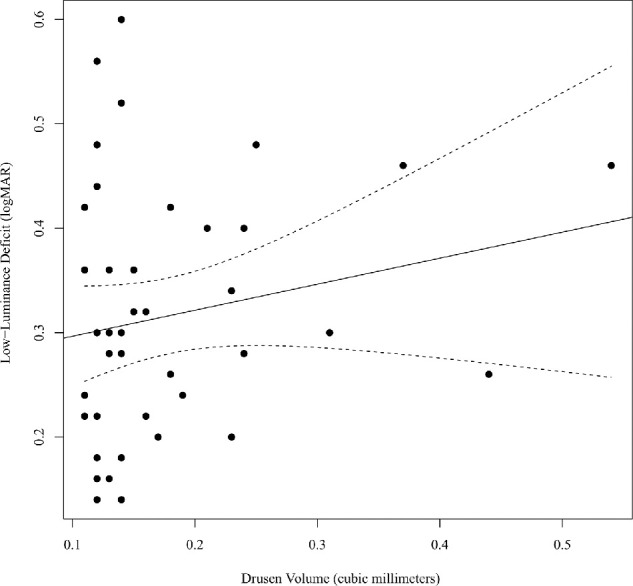
Scatterplot of drusen volume (mm3) versus LLD. The bivariate linear regression line is plotted (solid) with the 95% CI for mean predicted values (dashed).

Scatterplot of drusen volume (mm3) versus LLD. The bivariate linear regression line is plotted (solid) with the 95% CI for mean predicted values (dashed).