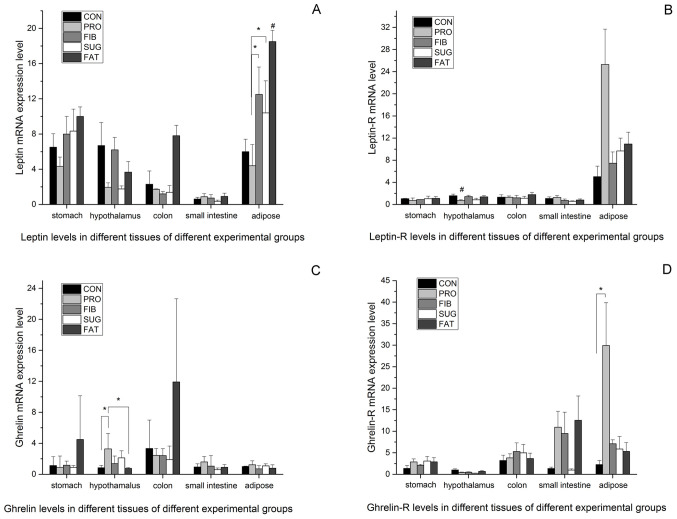
Figure 3.
Leptin and ghrelin expression in different tissues of the five groups. (A) Leptin mRNA levels; (B) leptin receptor mRNA levels; (C) ghrelin mRNA levels; (D) ghrelin receptor mRNA levels. *P<0.05 vs. two assigned groups, #P<0.05 vs. one assigned group compared with the other groups. Groups: CON, normal control diet; PRO, high-protein diet; FIB, high-fibre diet; SUG, high-sugar diet; FAT, high-fat diet.

