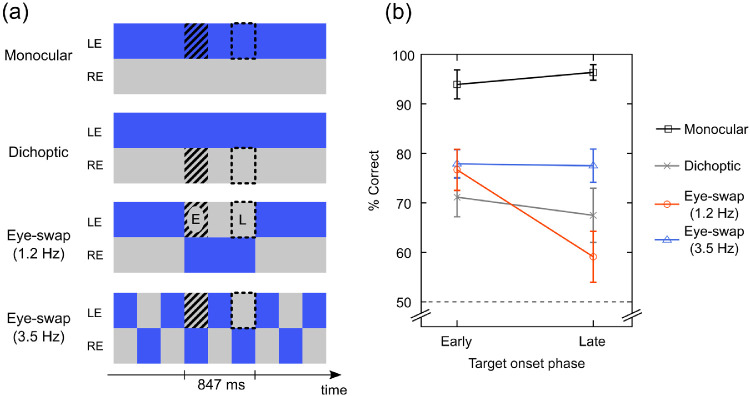
Figure 3.
Stimulus conditions and results of Experiment 2. (a) Schematic illustration of the target presentation in different eye-of-presentation conditions. The format of the illustration is the same as that of Figure 1(b). A brief target was presented either at an early (depicted by “E”) or a late phase (“L”) of the suppressor presentation half-cycle in the 1.2-Hz eye-swapping condition (third row). The target was presented at the corresponding timing in the other conditions. (b) Percent correct performance of the target detection task was plotted as a function of target onset phase. Different symbols represent different eye-of-presentation conditions. Error bars indicate ±1 SEM across observers. The dashed line designates the chance level of the task (50%). LE and RE represent the left eye and the right eye, respectively.

