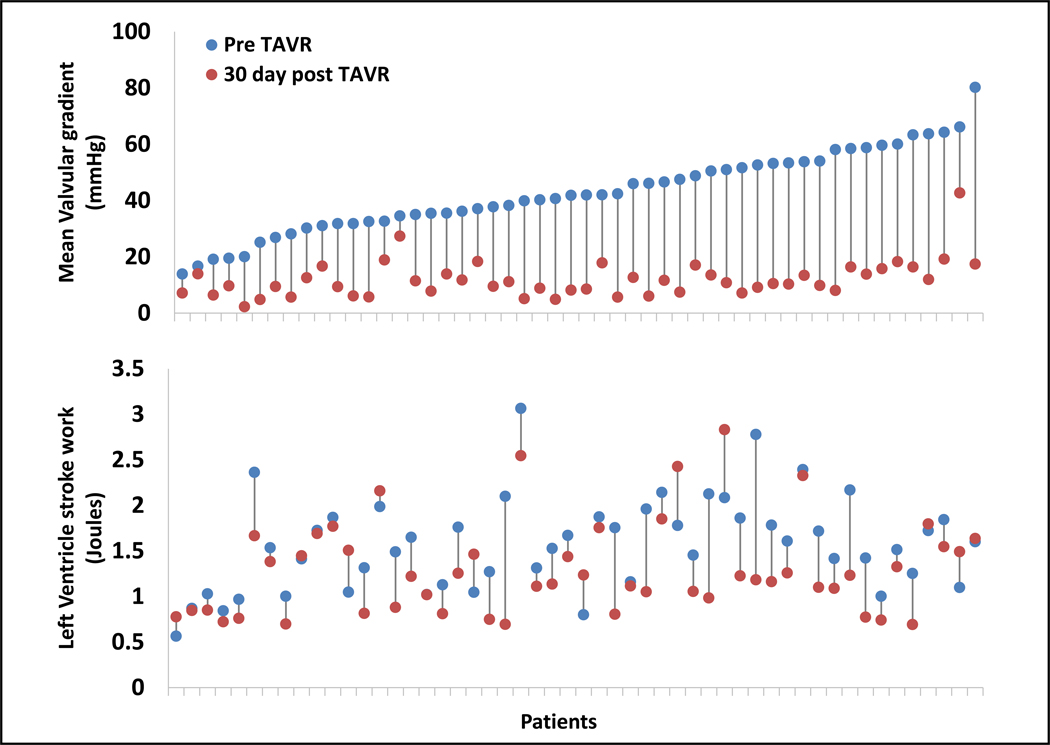
Fig. 4. Changes in left ventricle stroke work and valvular pressure gradients.
Minimum-maximum plots representing patient-specific changes from baseline to 30 days post-TAVR in mean valvular gradient (upper panel) and in left ventricle stroke work (lower panel) (Each data point represent average of two measurements of a single patient). There is no correlation between the decrease in transvalvular pressure gradient after TAVR and the change in left ventricle stroke work (R = 0.213, P = 0.129; n=52; fig S2). R represents the Pearson correlation coefficient

