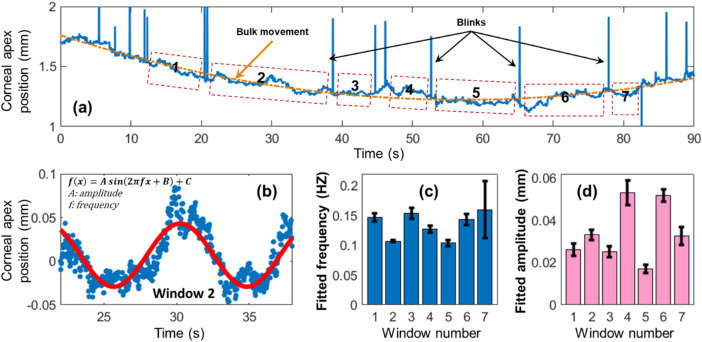
Figure 2.
Axial corneal positions were observably affected by respiration. (a) Axial corneal position tracking of subject 1 by OCT imaging. Bulk motion (orange line) and respirational fluctuation were clearly seen from the raw data. A total of seven subwindows were selected for analysis. Panel (b) demonstrates a sinusoidal pattern for window 2, which was dominated by respiration. Panels (c) and (d) demonstrate the fitted (mean ± 95% CI) respirational motion frequencies and amplitudes for each subwindow.

