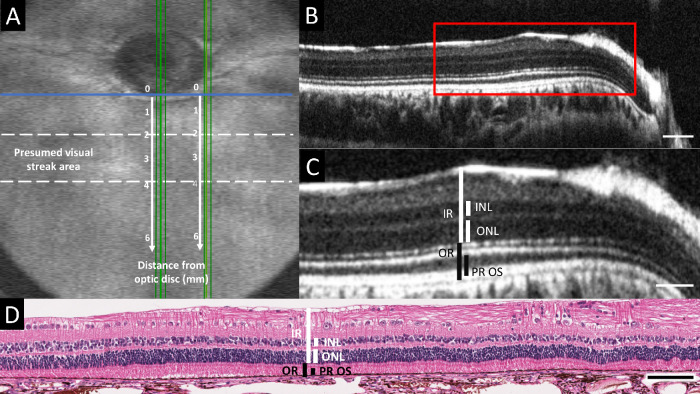
Figure 2.
Retinal thickness measurement methodology. (A) OCT volume intensity projection providing an overview of a rabbit fundus, including the optic nerve head (ONH) and presumed visual streak area (between dotted lines). Retinal thickness measurements were collected from vertical OCT scans and histologic sections passing through the center and the nasal rim of the ONH (vertical green lines). For each location, the measurements were repeated at five different positions at 1, 2, 3, 4, and 6 mm ventral to the ONH rim (vertical white arrows and numbers). A horizontal line parallel to the ventral rim at the center of the ONH (horizontal blue line) was taken as zero-position benchmark for both central and nasal measurements. (B) Vertical SD-OCT B-scan image along one of the green lines (replicates) passing through the center of the ONH in panel A. (C) Magnified B-scan image of the area indicated by the red rectangle in panel B, including the visual streak. The retinal thickness measurements collected from OCT B-scan images and histology sections are indicated in white for the inner retinal layers and in black for the outer retinal layers. IR (inner retina): linear distance between internal limiting membrane (ILM) and external limiting membrane (ELM); INL (inner nuclear layer); ONL (outer nuclear layer); OR (outer retina): linear distance between ELM and the choriocapillaris (CC); PROS (photoreceptor outer segment length): hyporeflective photoreceptor outer segment (OS) band + hyperreflective interdigitation zone (IZ) band on OCT, linear distance between the interface of inner and outer photoreceptor segments and the surface of the RPE on histology. (D) Hematoxylin-eosin stained retinal section corresponding to the area depicted by the OCT image in panel C. Scale bar = 100 µm (B), 50 µm (C), and 100 µm (D)

