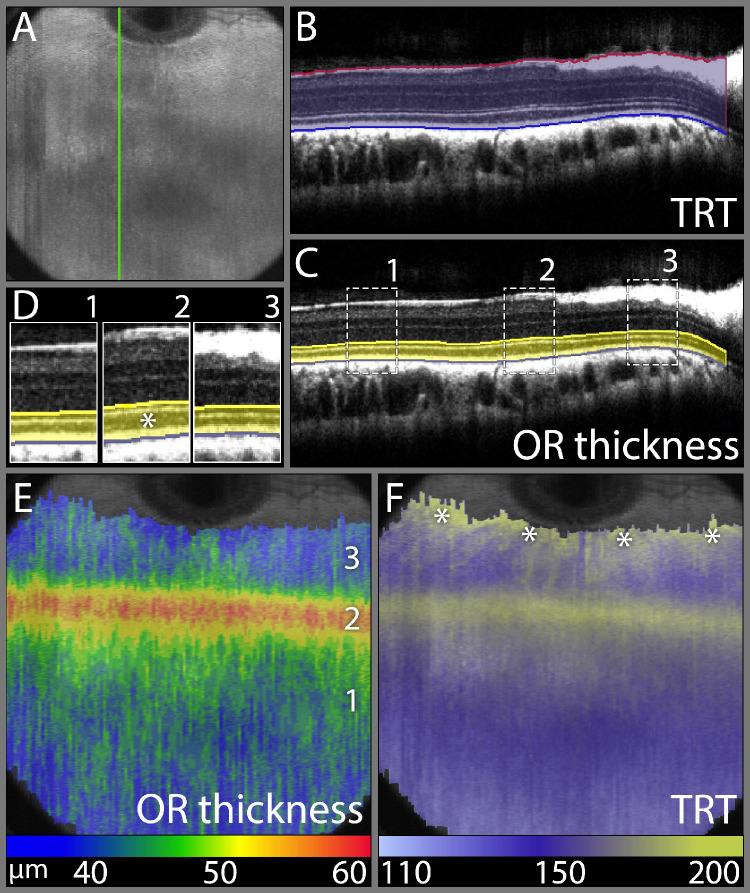
Figure 5.
Total and outer retinal thickness topography demonstrating the extent of the rabbit visual streak. (A) OCT volume intensity projection image presenting an overview of a rabbit fundus corresponding to the retinal region imaged with a 12 × 12 mm volume scan. (B) SD-OCT B-scan along the green line in panel A illustrating the manually assisted segmentation of the ILM-vitreous interface and RPE/BM-choriocapillaris interface to obtain a total retinal thickness (TRT) topography. (C) SD-OCT B-scan along the green line in panel A illustrating the manually assisted segmentation of the ELM line and RPE/BM-choriocapillaris interface to obtain an outer retinal (OR) thickness topography. (D) Magnified and juxtapositioned sections of three different locations indicated in panel (C). Zone 2 is in the center of the visual streak and is easily recognized by the thickened hyporeflective outer segment band (*), compared to zones 1 and 3, which lie outside the visual streak. (E) OR thickness topography projected onto the OCT volume intensity projection image from panel A. This image demonstrates a horizontal band of increased OR thickness at 3mm ventral to the ventral ONH rim and centered over zone 2 from panels C and D, which demonstrates the increased thickness of the outer retina in and the extent of the rabbit visual streak. (F) TRT topography projected onto the OCT volume intensity projection image demonstrating two areas of increased thickness, one corresponding to the VS on the OR thickness topography and the second indicating the ventrally directed medullary rays at the dorsal image edge (asterisks). False color scales are used to indicate OR thickness and TRT in µm in panels E and F, respectively.

