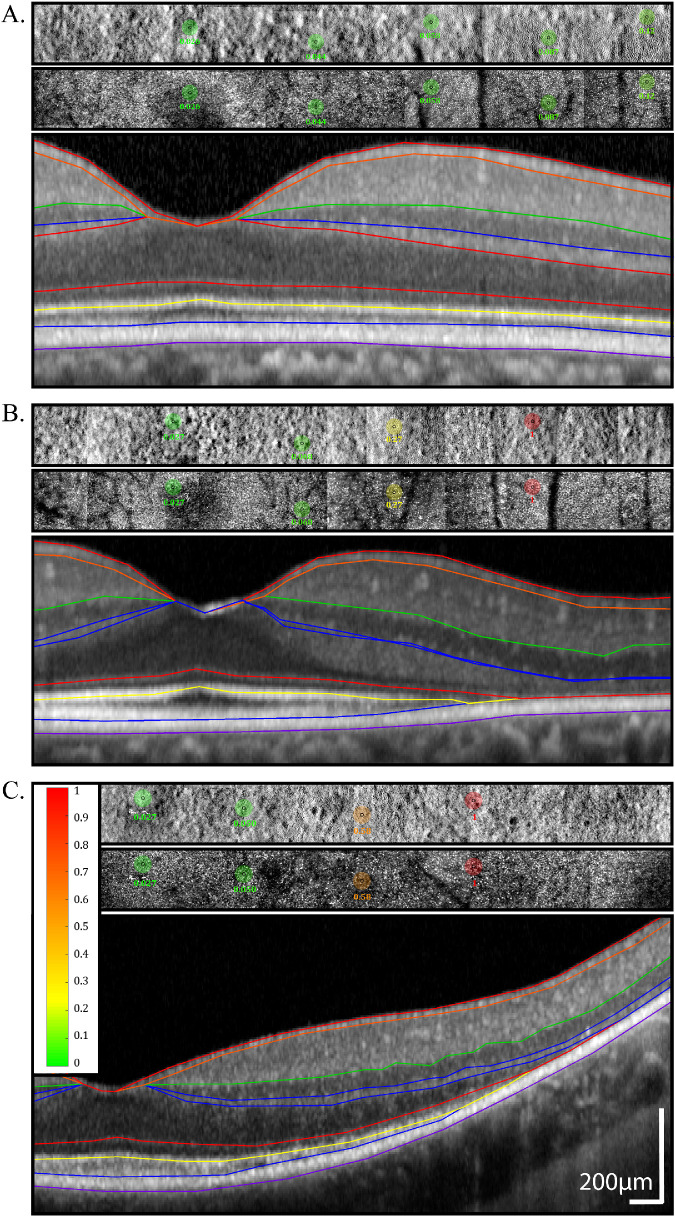
Figure 1.
AOSLO split-detector and confocal images with AOMP test locations superimposed and SD-OCT B-scans beneath each AOSLO/AOMP image. Images are from a normal (40154) subject (A), a patient (40095) with a RHO mutation (B), and a patient (40064) with a RPGR mutation (C). Retinal sensitivity values in color-coded circles are shaded from green (normal) to red (stimulus not seen) based on the sensitivity measured at each location; color scale bar at left of panel; scale bar: 200 µm. The inner black circle represents the actual stimulus size, and the bigger colored circle is 10 times larger to increase its visibility in the figure. The B-scans show interpolated boundaries based on manual segmentation of the RPE/Bruch's membrane, outer segment-RPE (OS/RPE), IS/OS, external limiting membrane, inner nuclear layer/outer plexiform layer, inner plexiform layer/inner nuclear layer, retinal nerve fiber layer/retinal ganglion cell, and vitreous/nerve fiber layer borders.17,18,20,21,44

