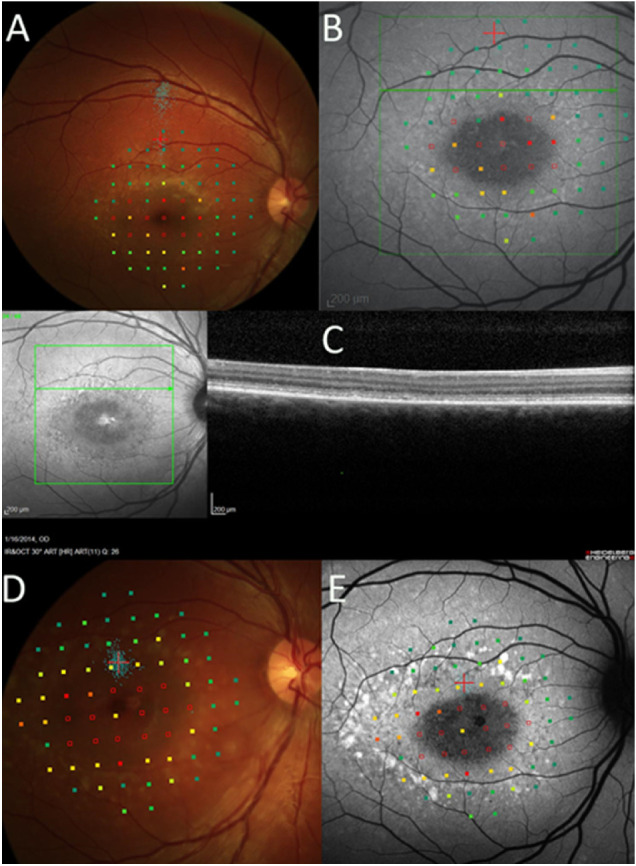
Figure 3.

The 10-2 microperimetry, SW-AF, and OCT findings at baseline and 24 months. Empty red squares indicate sites of dense scotoma. Solid red squares indicate that the brightest (0 dB) stimulus was seen. A pseudocolor map is used to indicate the retinal sensitivity, with green squares indicating that the dimmest stimuli (near 20 dB) were seen. The small blue dots show fixation sites during testing. (A) At baseline, fixation was far removed from the edge of the dense scotoma (blue dots; more remote than where the fixation cross was originally positioned). (B) At baseline, fundus autofluorescence imaging, with microperimetry overlaid, shows that the dense scotoma does not exceed the dark central lesion. The background pattern is other pattern, with subtle hyperautofluorescent flecks but without hypoautofluorescent mottling. (C) The FIL of the OCT is near the edge of the dense scotoma. It does not explain why the fixation is remote. (D) At 24 months, fixation is placed at the edge of the dense scotoma. (E) At 24 months, fundus autofluorescence imaging shows that the hyperautofluorescent lesions are more prominent, but the pattern remains other pattern.
