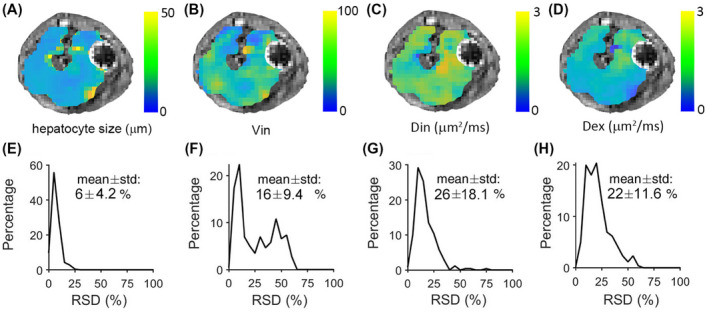
FIGURE 2.

Parametric maps (A‐D) and histograms (E‐H) of voxel‐wise relative standard deviations (RSDs) of fitted cell size d, intracellular diffusion coefficient Din, extracellular parameters Dex, and ratio of Vin and Vex, from a single slice of rat liver
