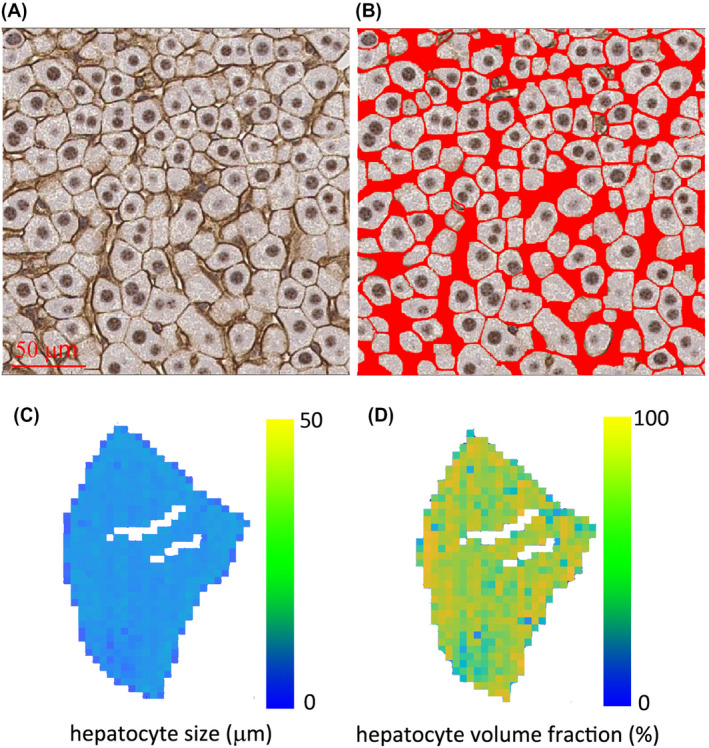
FIGURE 3.

Histological analysis on a rat liver. A, Representative histological picture of β‐catenin‐stained liver tissues. B, Segmented hepatocytes with red color marking the extracellular spaces. Maps of hepatocyte size (C) and hepatocyte volume fraction (D) calculated from the segmented histological picture
