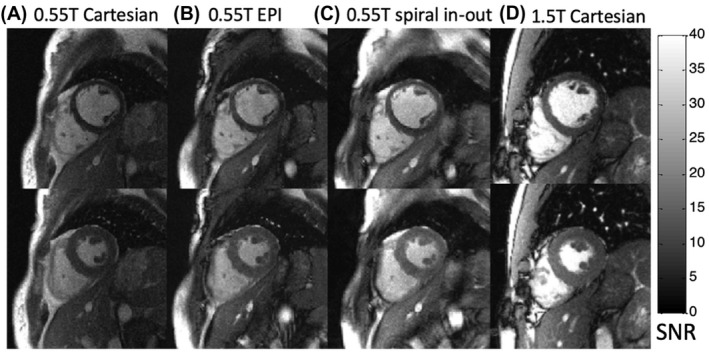
FIGURE 5.

Pixel‐wise SNR maps for cine frames from 0.55T Cartesian, EPI, and spiral in‐out bSSFP acquisitions and 1.5T Cartesian imaging in a single volunteer. Images from end‐diastole (top row) and peak systole (bottom row) are provided. Images are displayed in units of SNR. 30 T, tesla
