
FIGURE 6.
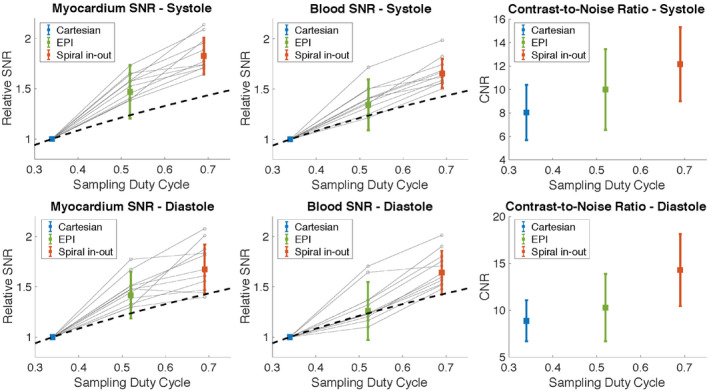
Relative myocardial SNR, blood SNR, and blood‐myocardium CNR for 12 healthy volunteers at peak‐systole and end‐diastole (mean ± SD). Spiral in‐out and EPI SNR values are shown relative to reference Cartesian imaging. Gray dots show individual measurements. High variance in SNR for EPI is due to corruption by motion/flow artifact. The dotted line represents theoretical SNR (by ). CNR, contrast‐to‐noise ratio