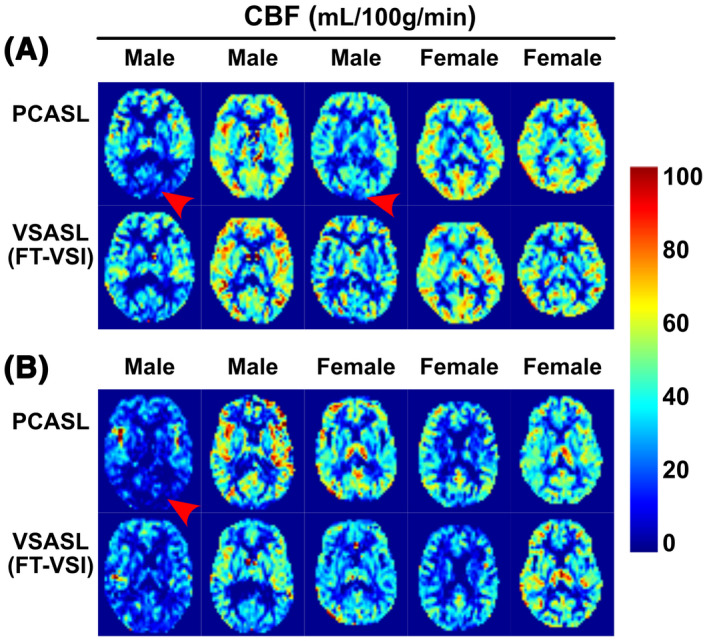
FIGURE 6.

Quantitative CBF maps (one slice) using PCASL and FT‐VSI prepared VSASL of each participant from the young‐age group (A) and the middle‐age group (B). Note that the PCASL results of several subjects show CBF underestimation in the occipital lobes (red arrowhead), most likely related to its sensitivity to long transit time delay or inefficient labeling. In contrast, VSASL results do not display such artifacts
