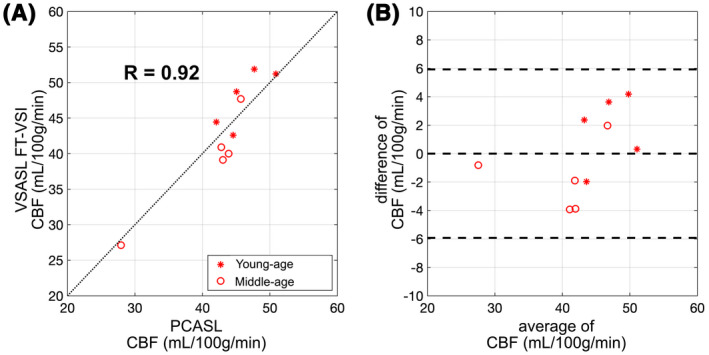
FIGURE 7.

Correlation (A) and agreement (B) plots of the averaged individual CBF values measured between FT‐VSI prepared VSASL and PCASL of gray matter ROIs from subjects of the young (stars) and the middle‐age (open circles) groups. For the correlation plots (A), the black dashed lines show the unity line y = x. The Bland‐Altman plot are shown in (B), in which the difference of the two methods are plotted against their mean, with the middle of the three horizontal dashed lines indicating the mean difference of all subjects, and the top and bottom dashed lines indicating the mean difference ± two times of the standard deviation of their differences
