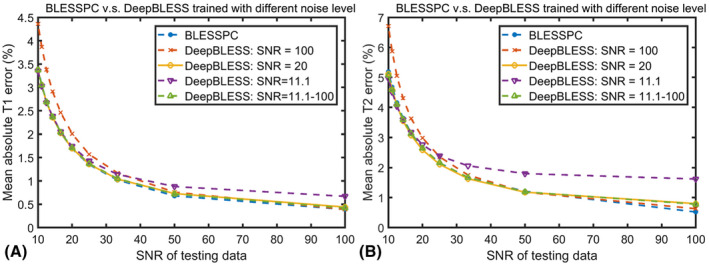
FIGURE 3.

Mean percentile absolute T1 (A) and T2 (B) reconstruction error as a function of the testing data noise level (SNR = 10‐100) for radial T1‐T2 mapping using the four models trained based on training data with different added noise (SNR = 11.1, 20, 100 and composite SNRs 11.1‐100), in comparison with conventional Bloch equation simulation with slice profile correction (BLESSPC)
