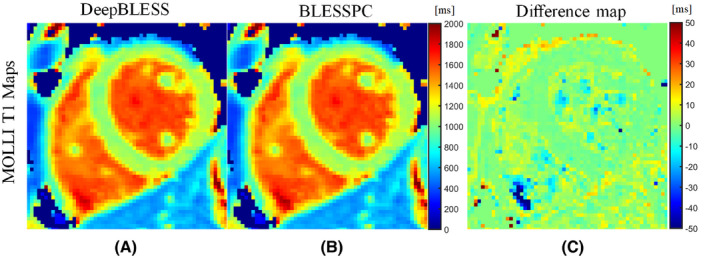
FIGURE 9.

In vivo MOLLI T1 mapping acquired at 1.5 T: example of T1 maps generated using DeepBLESS (A) and BLESSPC (B) and the corresponding difference map (C) in a healthy subject. All of the pixels that BLESSPC did not fit well (R2 < 0.98) were set to 0 for all corresponding maps. The maps generated by DeepBLESS and BLESSPC were similar in the heart region. In the left‐ventricular myocardial region, the average T1 difference between DeepBLESS and BLESSPC was −0.5 ± 1.7 ms
