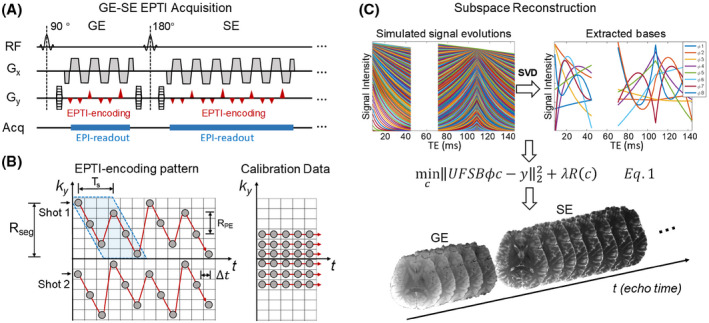
FIGURE 1.

The graphic illustration of EPTI acquisition and subspace reconstruction. (A) The diagram of 2D GE‐EPTI sequence, and (B) an example of EPTI encoding pattern and fully sampled calibration in k y‐t space. In EPTI encoding, two adjacent ky line‐sections are interleaved in the PE direction (as show in the blue block), and separated in time by Ts. Δt is the ESP, RPE is the undersampling factor of two sequentially PE lines, and Rseg is the segment size along PE direction of each shot. Figure 1C shows that in subspace reconstruction, signal evolution curves with T2/ decay are simulated based on the tissue and acquisition parameters. The subspace bases are extracted by PCA, and used in reconstruction to approximate the actual signal temporal evolution
