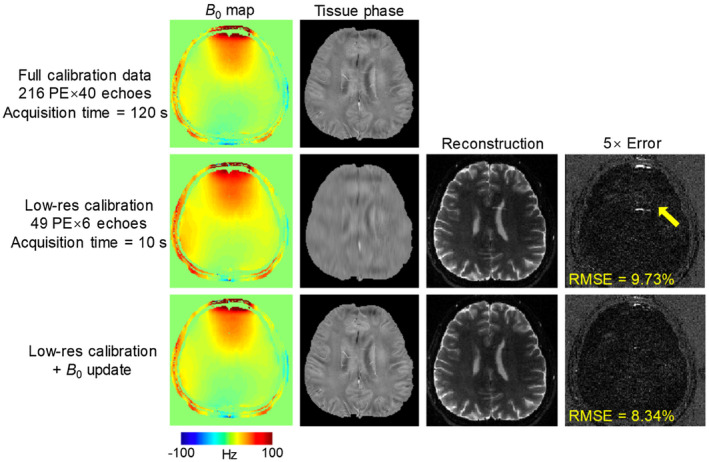
FIGURE 5.

The results of B 0 update evaluation. On the top, high‐resolution B 0 map and tissue phase were calculated from the fully sampled dataset with 216 PE and 40 echoes, which takes 120 seconds for 10 slices. In second row, reconstructed images and phase from a low‐resolution calibration with 49 PE × 6 echoes are shown. Using low‐resolution data, acquisition time can be reduced to only 10 seconds, but causes image artifacts in the reconstructed image. The bottom row shows the estimated high‐resolution phase and image from the B 0 update algorithm, where the artifacts due to inaccurate phase are reduced
