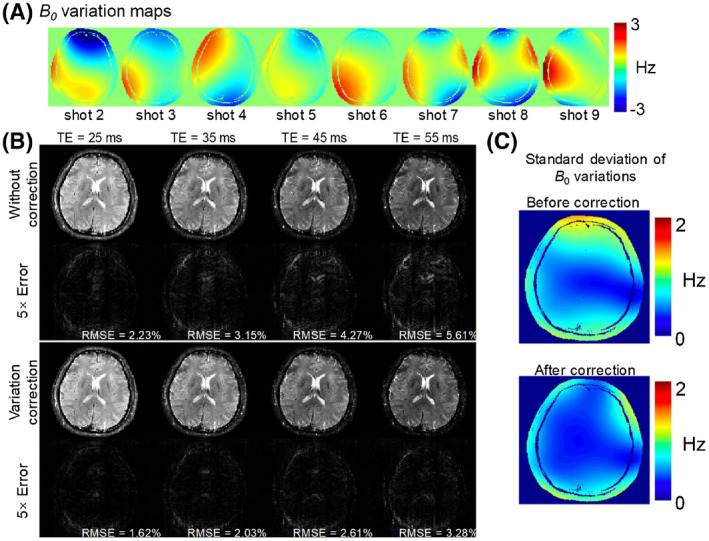
FIGURE 6.

Results of B 0 variation correction in the simulation test. (A) Realistic B 0 maps obtained from an in vivo scan across the 9 shots. (B) The reconstructed images and error maps (×5) with and without variation correction at four different TEs. (C) The standard deviation of B 0 variation across 9 shots before and after correction. After variation correction, the standard deviation and reconstruction errors are all reduced
