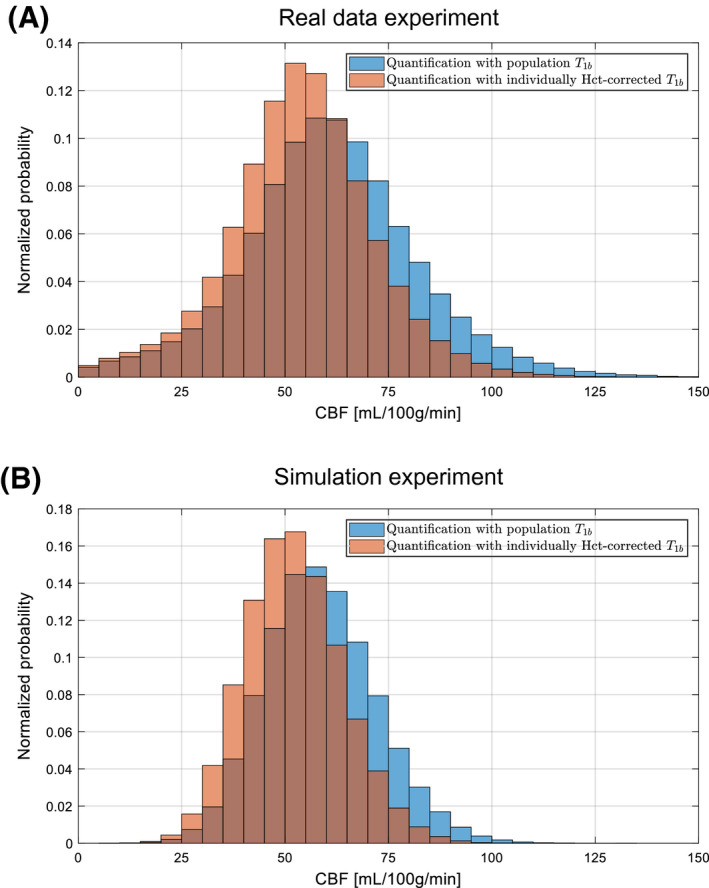
Figure 6.

(A), Normalized distribution of the set of estimated GM CBF values, pooled over the considered population of 10 healthy volunteers, for quantification with a single population average for blood (blue) and with individual blood values (orange), estimated from a hematocrit measurement. (B), Normalized distribution of the set of estimated GM CBF values for the simulation experiment that closely mimicked the real data experiment
