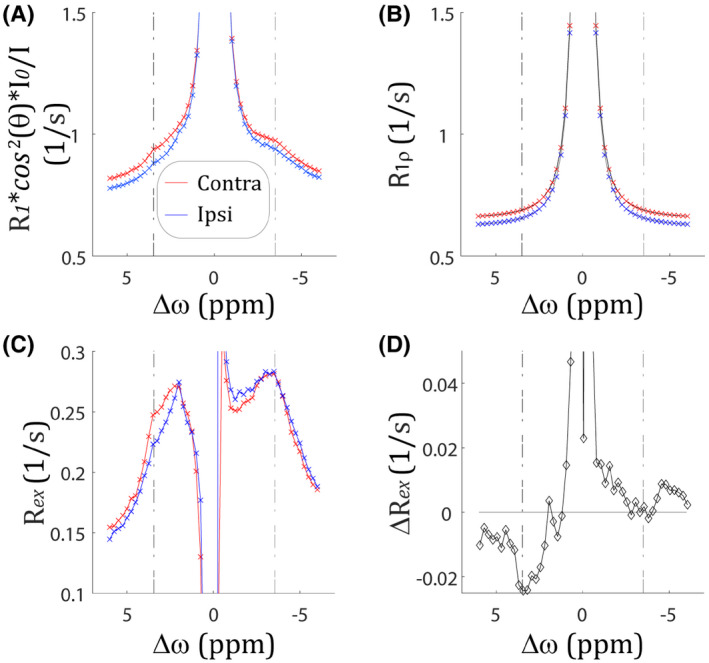
FIGURE 3.

Characterization of ischemia‐induced inverse CEST Z‐spectral signal change. A, The R1‐scaled inverse CEST Z‐spectral changes between the contralateral normal area (red) and ipsilateral ischemic region (blue). B, Intrinsic R1ρ spectral changes between the contralateral normal area (red) and the ipsilateral ischemic region (blue). C, The Rex spectral changes between the contralateral normal area (red) and the ipsilateral ischemic region (blue). D, The Rex spectral difference between the contralateral normal area and ipsilateral ischemic lesion
