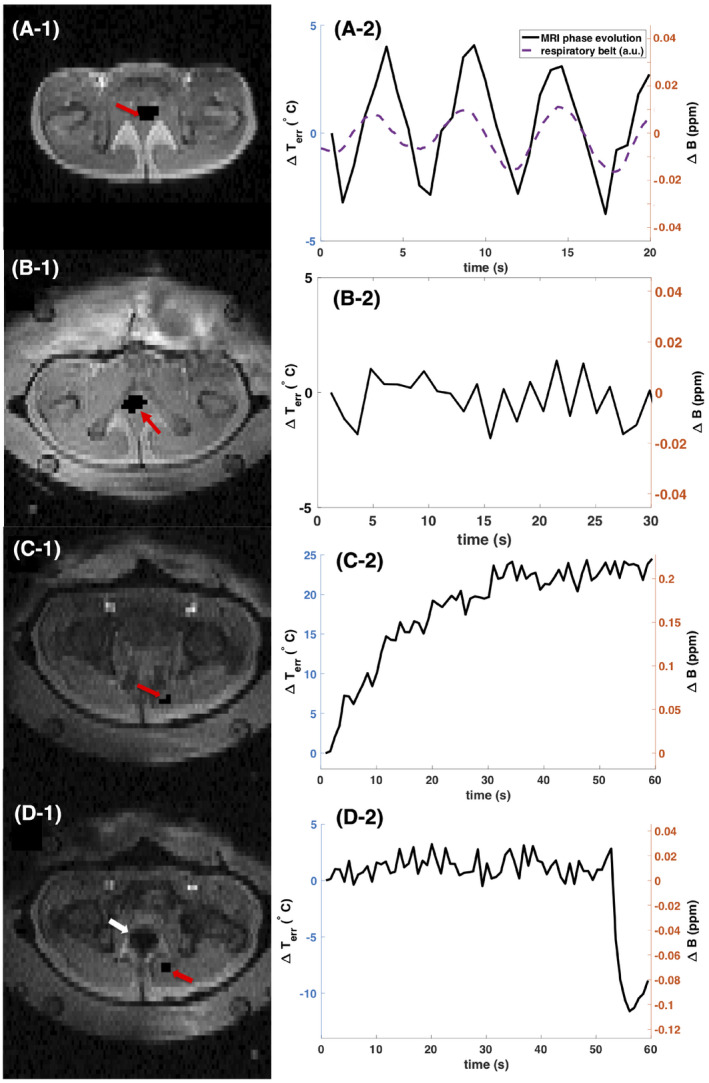
FIGURE 3.

Disentangling motion‐induced susceptibility artifacts during proton resonance frequency shift (PRFS) MR thermometry in the pelvis outside and inside the RF‐HT applicator. The left column displays the magnitude data of the studied 2D MR slice of the pelvis. Red arrows point at the region of interest (ROI) for which the mean phase evolution in ppm and the resulting erroneous temperature estimation over time are plotted in the right column. The white arrow points at digestive gas appearing in the imaged slice. Even though no tissue displacement was visible, except for the intestinal gas induced tissue deformation in image D‐1, significant phase variation was observed in all cases due to the propagating character of the dipole‐shaped susceptibility artifacts. In the first row the subject was placed inside the scanner bore without the applicator. In the second, third, and fourth row the RF‐HT applicator was positioned around the pelvis and the water bolus was filled with water
