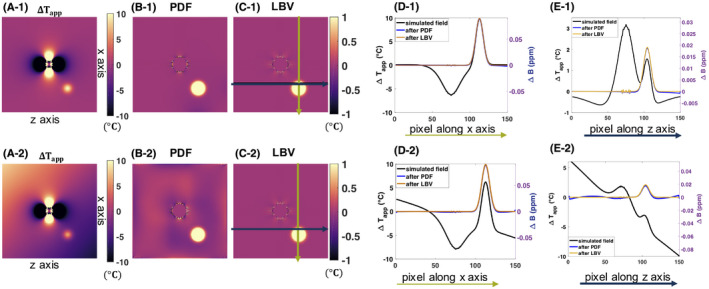
FIGURE 4.

Simulation results of field disturbance introduced by susceptibility change and the impact of background field removal. The first row represents a case where a susceptibility change in the center of the image caused a dipole field in the phase difference image. In addition, a Gaussian distributed temperature rise was added. In the second row, a linear B0 drift was added on top of the temperature rise and susceptibility change‐induced field changes. A, apparent temperature change in °C if no correction was applied, B, apparent temperature increase after projection onto dipole fields (PDF), C, apparent temperature increase after Laplacian boundary value (LBV), D, line profile of the simulated original field and the PDF‐ and LBV‐corrected fields and apparent temperature change, corresponding to the vertical green line illustrated in C), E, line profile of the simulated field and the PDF‐ and LBV‐corrected apparent temperature and field, corresponding to the horizontal black line illustrated in C). Z axis corresponds to the orientation of the main magnetic field, whereas x axis is perpendicular to it. The nonsmooth, noise‐like field variation in the middle of the axis originates from numerical simulation of the disturbing field from a nonperfect sphere and persists after background field removal (BFR) correction. However, this is not a concern for experimental or in vivo data
