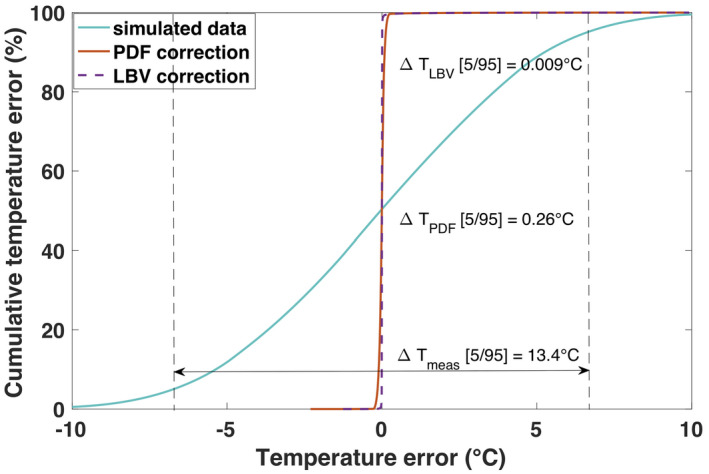
FIGURE 5.

Cumulative distribution functions of the temperature error before (turquoise line) and after application of the background field removal methods, projection onto dipole fields (PDF) or Laplacian boundary value (LBV). The simulation data with B0 drift, as illustrated in Figure 4‐2), is represented. The entire simulated 3D volume was used for calculation of the cumulative error
