
FIGURE 6.
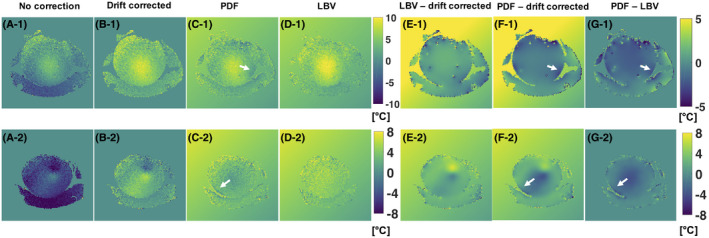
Temperature change maps ( ‐maps) from the phantom heating experiment using Double Echo Gradient Echo (DEGRE) data acquisition and different correction methods for 2 different slices. The last time point, 50 minutes after the acquisition of the reference image, was chosen. The first row displays the temperature increase maps for a middle slice. The second row displays the temperature change maps at the border of the phantom, in which we observed the formation of a dipole field from some motion‐induced susceptibility change. A, ‐maps derived from DEGRE data without correcting for B0 drift, B, ‐maps with B0 drift correction, C, ‐maps after applying PDF for background field removal (BFR), D, ‐maps after applying Laplacian boundary value (LBV) for BFR, E, difference of ‐maps using the method shown in B) and D), F, difference of ‐maps using projection onto dipole fields (PDF) and only drift correction, G, difference of ‐maps PDF compared to LBV method. The white arrows point at areas where PDF overestimated the background field locally at the border of the phantom