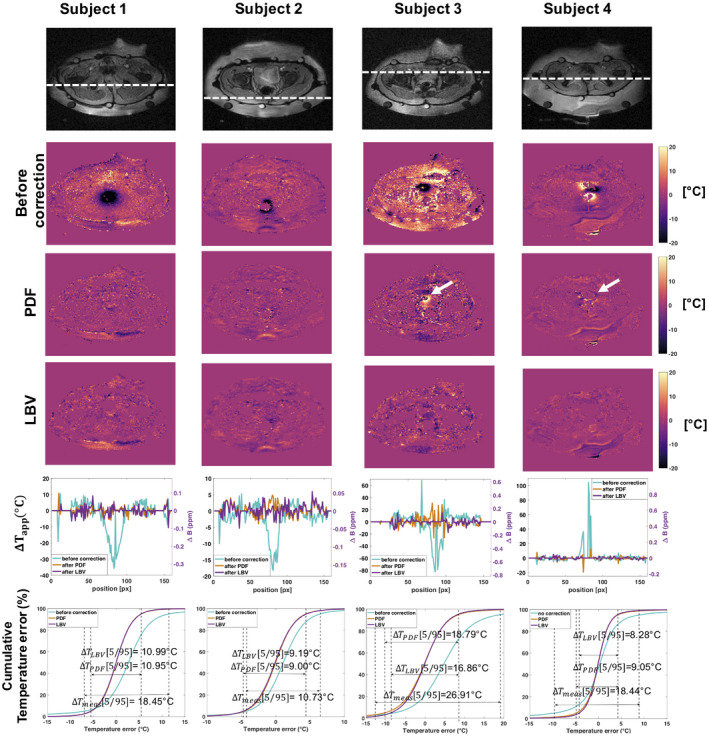
FIGURE 8.

Results of stability study in 4 healthy volunteers at constant temperature. 1st row: magnitude image of the slice for which the temperature maps are displayed below. The dashed line corresponds to the location of the line plot in the 5th row of the same figure. 2nd row: temperature error maps due to intestinal motion containing gas. 3rd row: temperature error maps after projection onto dipole fields (PDF) correction. The white arrows point at locations where large residual phase is still observable after background field removal (BFR). 4th row: temperature error maps after Laplacian boundary value (LBV) correction. 5th row: line plots displaying temperature errors before and after BFR correction in the respective subject at the location shown in the first row. 6th row: cumulative distribution functions of the temperature error before and after BFR. Only voxels within the subject were considered, excluding pure noise locations and data from the water bolus
