
Figure 2.
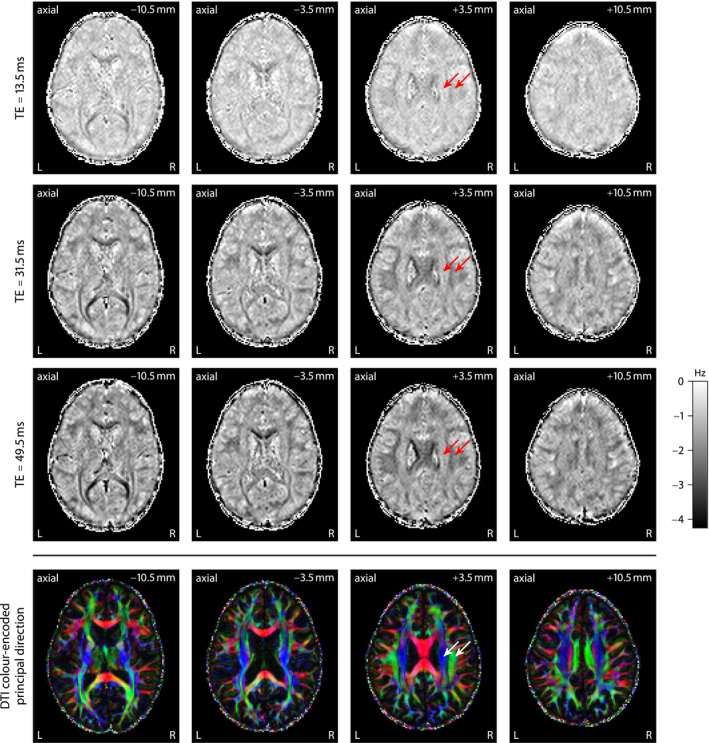
Frequency difference mapping, 17 , 18 shown for 3 echo times at a single magnetic field direction in various axial planes, demonstrates that the gradient‐echo frequency shift contrast is largely due to its dependence on echo time and the orientational heterogeneity of brain white matter. For comparison, the bottom row depicts the DTI color‐encoded principal direction. Left (L), right (R)